Physical Vapor Deposition Market Snapshot: Market Size, CAGR, and Growth Outlook to 2032
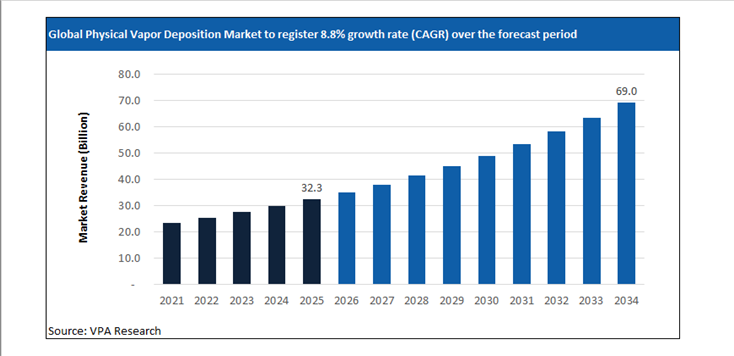
Global Physical Vapor Deposition Market Size is projected to hit $69 Billion in 2034 at a CAGR of 8.8% from $32.3 Billion Million in 2025.
The report analyzes the global Physical Vapor Deposition Market across diverse segments including By Technology (Sputter Deposition, Evaporation Deposition, Cathodic Arc Deposition, Pulsed Laser Deposition (PLD), HiPIMS), By Service Type (PVD Equipment, PVD Materials, PVD Services), By End-Use Industry (Semiconductor & Electronics, Cutting Tools, Solar Products, Medical Devices, Decorative Coatings).
The Physical Vapor Deposition Market Market at a Glance (2026)
Industrial-scale Physical Vapor Deposition adoption across semiconductors, optics, and advanced manufacturing
The physical vapor deposition market in 2026 is shaped by structurally higher reliance on precision surface engineering across semiconductors, data storage, medical devices, and high-performance tooling. PVD coating systems are increasingly specified where atomic-scale film control, adhesion reliability, and contamination minimization are non-negotiable. In semiconductor manufacturing, PVD remains integral for barrier layers, seed layers, and metallization steps that demand uniformity at sub-10-nanometer tolerances. This role has become more technically exacting as device architectures migrate toward complex three-dimensional geometries, placing sustained emphasis on chamber design, plasma control, and target material purity.
During 2025, Applied Materials announced the expansion of its specialty materials engineering operations in the United States, explicitly highlighting enhanced PVD and hybrid deposition tool capabilities for logic and advanced packaging nodes. The announcement reflects how equipment suppliers are responding to tighter customer specifications around defect density and film conformity rather than throughput-led metrics. In parallel, ASM International confirmed additional R&D investment in plasma-enhanced deposition platforms in Europe, positioning PVD as a complementary process to ALD in multilayer stacks where throughput and cost discipline remain critical.
Beyond semiconductors, PVD thin film coatings continue to displace legacy chemical and electroplating processes in cutting tools and industrial components. Tool manufacturers increasingly specify multi-layer PVD coatings to balance hardness, oxidation resistance, and thermal stability under high-speed machining conditions. This has reinforced demand for cathodic arc and magnetron sputtering technologies that can reliably deposit complex nitride and carbide stacks. The shift is not cosmetic; it is driven by quantifiable reductions in tool wear variability and rework rates across automotive and aerospace supply chains.
Regulatory pressure and material innovation redefining PVD equipment demand
Environmental and occupational safety regulations are exerting a direct influence on PVD equipment demand. Restrictions on hexavalent chromium, solvent-heavy wet processes, and hazardous electroplating chemistries continue to tighten across the European Union, North America, and parts of East Asia. These constraints are accelerating substitution toward vacuum-based deposition systems that offer closed-loop material utilization and lower waste profiles. In 2025, Germany’s Federal Ministry for Economic Affairs publicly backed advanced surface engineering investments as part of its industrial decarbonization framework, explicitly referencing vacuum coating technologies as preferred alternatives for metal finishing in automotive and machinery sectors.
Material innovation is reinforcing this transition. Target suppliers are introducing higher-purity alloys and compound materials designed to stabilize plasma behavior and reduce particle generation during long deposition cycles. These advances are particularly relevant in optical coatings and precision electronics, where even minor film defects can cascade into yield losses downstream. PVD target materials are no longer treated as interchangeable commodities; procurement teams increasingly qualify them alongside equipment platforms to ensure process repeatability across global fabs.
In Asia, ULVAC announced in 2025 the commissioning of an expanded vacuum coating equipment manufacturing line in Japan, citing rising orders from electronics and display panel producers. The move underscores how regional supply chain resilience considerations are influencing capital allocation decisions in the PVD ecosystem. Equipment localization and service proximity are now embedded into vendor selection criteria for multinational manufacturers operating multi-continent production footprints.
Competitive dynamics and cross-sector convergence shaping the PVD landscape
The competitive structure of the global physical vapor deposition market is increasingly defined by cross-sector convergence rather than siloed end-use specialization. Equipment suppliers that historically focused on semiconductors are adapting platforms for medical implants and energy applications, while industrial coating specialists are integrating digital process controls originally developed for electronics fabs. This convergence favors vendors with deep process modeling capabilities and application engineering teams capable of co-developing solutions with customers.
In 2025, IHI Ionbond announced a strategic collaboration with a European medical device manufacturer to scale PVD-coated orthopedic components, highlighting how service-based PVD providers are moving upstream into application-specific partnerships. Such collaborations signal a broader trend in which coating performance validation, regulatory documentation, and lifecycle support are becoming differentiators alongside deposition hardware specifications.
As manufacturing tolerances tighten across industries, physical vapor deposition technology is increasingly evaluated not as a discrete process step but as a system-level enabler of reliability, compliance, and long-term cost control. This reframing continues to elevate the strategic importance of PVD across advanced manufacturing value chains.
Global Physical Vapor Deposition Market Market Dynamics: Growth Drivers, Restraints, and Opportunities
Strategic Market Drivers: What’s Fueling Growth in 2026?
The Physical Vapor Deposition Market market report provides a comprehensive assessment of the structural and technical factors shaping the market’s evolution in 2026 and beyond. It evaluates demand-side shifts, supply-side constraints, regulatory influences, and technology-led disruption impacting both established players and new market entrants. The Physical Vapor Deposition Market market analysis details the impact of changing end-use requirements, evolving customer specifications, and increasing performance expectations across countries. Further, key drivers and opportunities are mapped across regional and application-level dynamics.
Profit Prioritization and Portfolio Rebalancing
-
Asset Rationalization: Tier 1 players are aggressively divesting low-margin, commoditized assets to reallocate capital toward high-purity, differentiated offerings with superior pricing power.
-
Operating Leverage: Amidst persistent raw material volatility, companies are leveraging Digital Twins and AI-driven manufacturing to optimize OpEx.
-
Specialty Transition: Strategic investments are now concentrated in high-growth niches where customized formulations and technical barriers to entry protect EBITDA margins from global overcapacity in basic chemicals.
A Deep Dive into Emerging Market Hubs
Rapid economic growth, coupled with demand for Physical Vapor Deposition Market are driving the investment focus on these markets. In particular, India, China, Southeast Asia, Brazil, Eastern Europe, and Latin American markets are registering higher than the global average growth rate. The urban population is expected to reach 6 billion by 2045, around 1.3 times the surge from 2023 levels. Rapid industrialization, infrastructure development, urbanization, and expanding domestic consumption are driving above-average demand growth across markets. Leading Physical Vapor Deposition Market companies are accelerating investments in local manufacturing, regional supply chains, and application-specific product development to capture these opportunities.
Emerging Opportunities: Untapped High-Growth Niches in the Post-Pandemic Recovery
The post-pandemic landscape for the chemical industry shifted from crisis management to strategic opportunity. In 2026, leading companies are focused on supply chain regionalization, the hygiene-sustainability nexus, and the digital leap in R&D. The Physical Vapor Deposition Market market is witnessing the emergence of niche, high-growth segments driven by evolving customer needs and regulatory drive. Demand for customized formulations, performance-enhancing solutions, and application-specific variants is rising across advanced manufacturing, specialty end-use industries, and sustainability-led applications. The report identifies underpenetrated segments where innovation, technical differentiation, and faster go-to-market strategies can unlock disproportionate value.
Physical Vapor Deposition Market Market Challenge- Impact of Geopolitical Uncertainty on Market Stability
In 2026, geopolitical risk has become a structural variable shaping the Physical Vapor Deposition Market market rather than a short-term disruption factor. Ongoing trade realignments between the U.S., China, and the EU, coupled with sanctions regimes, export controls, and industrial policy interventions, are directly influencing sourcing strategies, production footprints, and pricing stability across the Physical Vapor Deposition Market value chain. Regional disparities in energy pricing, port congestion risks, and shipping route instability are creating uneven cost structures among global Physical Vapor Deposition Market producers. Accordingly, Physical Vapor Deposition Market companies with regionally diversified production assets and localized supplier ecosystems are demonstrating higher margin stability compared to export-reliant peers.
Physical Vapor Deposition Market Market Strategic Assessment: SWOT, Five Forces, and Value Chain Analysis
Scenario analysis
Amidst varying regulations, trade patterns, supply chain dynamics, and market dynamics, the scenario analysis allows firms to stress-test their current business models. The chapter provides three distinct ‘What-If’ pathways for the Physical Vapor Deposition Market market through 2032- high growth, low growth, and reference cases. The detailed forward-looking assessment ensures that strategic decisions made today remain viable across a range of potential economic and regulatory outcomes.
Value Chain Analysis
The report identifies key players across the Physical Vapor Deposition Market industry value chain, tracing the flow from procurement to end-user. By understanding supplier dependencies, processing intensity, distribution dynamics, and customer power at each stage, stakeholders can identify opportunities for vertical integration, strategic partnerships, localization, or operational optimization.
Porter’s Five Forces Analysis
The Porter’s Five Forces analysis chapter incorporates quantitative scoring and weighted impact evaluation for each competitive force within the Physical Vapor Deposition Market market. This section helps objectively measure industry attractiveness, margin sustainability, and competitive risk using a standardized analytical framework. Companies can evaluate the bargaining power of suppliers and buyers, the threat of substitutes and new entrants, and the degree of rivalry among existing players.
Market Segmentation: Historical and Projected Market Revenue Forecast
Revenue Growth Strategies for Physical Vapor Deposition Market Segments
The report provides the Physical Vapor Deposition Market market size across By Technology (Sputter Deposition, Evaporation Deposition, Cathodic Arc Deposition, Pulsed Laser Deposition (PLD), HiPIMS), By Service Type (PVD Equipment, PVD Materials, PVD Services), By End-Use Industry (Semiconductor & Electronics, Cutting Tools, Solar Products, Medical Devices, Decorative Coatings). Market size outlook across the segments is provided at the global, North America, Europe, Asia Pacific, South and Central America, and the Middle East and African regions. Across each segment, the report analyzes the growth prospects, post-pandemic recovery, and country-specific dynamics.
Regional Outlook for Physical Vapor Deposition Market Manufacturers
United States Physical Vapor Deposition Market Market Size and Share Analysis- Evolving Trade Policies and Supply Chain Reshuffling
The United States Physical Vapor Deposition Market market is being reshaped by evolving trade policies, industrial localization initiatives, and a reconfiguration of global supply chains. The outlook for 2026 is moderately higher relative to 2025, driven by policy-driven sourcing decisions, domestic manufacturing incentives, and strategic supplier realignment.
Global GDP forecasts fell to 3.0% in 2025 and 3.1% in 2026, with US growth slowing to 1.8% and 1.4%, respectively. Tariffs on critical intermediates have added around 0.5 percentage points to core inflation, squeezing the margins of downstream manufacturers. Similarly, an estimated 20% of manufacturers are likely to deploy physical AI to mitigate labor shortages in the US. Over the forecast period, as domestic pricing, margin profiles, and capacity utilization increasingly correlate with U.S.-specific trade exposure, logistics costs, and policy alignment, companies focus significantly on supply-chain optimization.
Canada Physical Vapor Deposition Market Industry Forecast 2026–2032- Increasing role in North America Supply Chain realignment
Canada’s real GDP growth is projected to average 1.25% to 1.5% in 2026, a modest recovery from the 1.3% growth seen in 2025. Unlike the high-volume commodity focus of previous decades, the current market is driven by high-value specialty segments. Strong end-user demand from Ontario, Alberta, Quebec, British Columbia, and other provinces is shaping the long-term growth strategies. The report analyzes the key market drivers and provides the Canada Physical Vapor Deposition Market market size outlook over the forecast period to 2032.
Mexico Physical Vapor Deposition Market - Companies are investing in Nearshoring hubs
Nearshoring into Mexico and Canada is accelerating, with the US-Mexico trade projected to grow by $315 Billion by the end of the decade. The American Chemistry Council (ACC), the National Association of the Chemical Industry of Mexico (ANIQ), and the Chemistry Industry Association of Canada (CIAC) are focusing on renewal and strengthening the USMCA. Geographic proximity to the United States enables just-in-time supply models, making Mexico a strategic production location for downstream chemical derivatives, resin conversion, coatings, adhesives, and formulation-based specialty products.
Germany Continues to Dominate the European Physical Vapor Deposition Market Industry
German giants are divesting non-core assets and emphasizing specialized applications, technical precision, and high-value customer solutions. For instance, Henkel’s $2.5 billion acquisition of Stahl Holdings in February 2026. Leading Physical Vapor Deposition Market companies are formulating strategies to mitigate short-term effects, including supply chain disruptions and destocking, and longer-term structural dynamics. Over the long-term future, demand outlook remains steady across key value chains, driving investments in new product launches and widening distribution channels.
UK- Post-Brexit Divergence and Specialized Clusters
The United Kingdom chemical industry in 2026 is shaped by divergent structural forces combining cost pressure with specialization-driven resilience. European natural gas prices remain structurally around 3.5× higher than U.S. levels, constraining energy-intensive bulk chemical economics and accelerating a pivot toward higher-value specialty chemicals, performance materials, and formulation-led production. Industry restructuring across the region is evident, with chemical plant closures in Europe increasing sixfold since 2022, according to Cefic, reinforcing the UK sector’s move away from commodity exposure toward efficiency-focused, technology-enabled operations. At the same time, logistics capacity is expanding, with the UK chemical logistics market growing at roughly 5% annually to reach about $8 billion in 2026, strengthening the country’s role as a storage, distribution, and re-export hub for specialty and regulated chemical flows.
China and India account for over 40% of global demand
China’s Physical Vapor Deposition Market industry is witnessing rapid capacity expansion, technology-led upgrading, and demand reorientation, with accelerated investment across value chain segments reshaping competitive dynamics. The $1.5 trillion chemical industry remains a primary engine of GDP growth, with a government-mandated target of 5% average annual growth in industrial added value through year-end 2026.
Demand fundamentals are also shifting structurally: by 2030, China and India together are projected to account for 40% of global middle-class consumption, up from less than 10% in 2010, indicating long-term expansion in consumption-driven Physical Vapor Deposition Market applications. Among end-user markets, Guangdong, Jiangsu, Shandong, Zhejiang, Sichuan, and others are widely focused on by vendors.
India remains a significant outlier with a projected 6.6% GDP growth in 2026, driving a surge in Physical Vapor Deposition Market demand. The government's $1.4 trillion National Infrastructure Pipeline is a massive driver for the market outlook. The Indian government is expected to expand the Production Linked Incentive (PLI) scheme for specialty chemicals in 2026.
Japan: Maintaining Dominance in High-Performance Segments
Japan’s Physical Vapor Deposition Market industry in 2026 is concentrated in high-performance, specification-critical segments where technical qualification barriers protect margins. Japan’s chemical sector remains one of the world’s most innovation-dense. In 2026, R&D spending in the sector continues to exceed $2.1 Billion annually, with Tokyo and the Kanto region serving as the global hubs for research. Persistent public-sector funding worth ¥4 trillion has moved capital toward advanced materials. To sustain competitive positioning in the evolving environment, Japanese firms can unlock growth by developing new markets through business model transformation and differentiated customer engagement strategies, reflecting the industry’s shift beyond product-led competition toward solution-oriented value creation.
Southeast Asia: The New Manufacturing Core
Southeast Asia is emerging as a primary manufacturing and chemical production growth zone, supported by industrial policy, infrastructure expansion, and supply chain diversification. Vietnam is advancing sector expansion under its Chemical Industry Development Strategy 2030, targeting average annual industry growth of 10–11% through 2030, with emphasis on petrochemicals, downstream plastics, industrial chemicals, and specialty materials serving electronics, construction, and export manufacturing.
The regional economy continues to be resilient, adapting to the shifting landscape and with momentum varying across countries and sectors. Concurrently, Indonesia is accelerating industrial capacity through its National Medium-Term Development Plan (RPJMN), which includes $414 billion in infrastructure investment, strengthening ports, energy systems, and industrial corridors critical for chemical logistics and processing industries.
Middle East- Rapid Economic Growth Supports Potential Business Expansion Opportunities
The Middle East chemical industry is strengthening its position as a global production and export hub through sustained capital deployment, feedstock integration, and downstream diversification. Between 2023 and the end of 2026, the region is tracking around 160 capital projects valued at more than $55 billion, reflecting continued investment in petrochemicals, polymers, specialty derivatives, and industrial chemicals.
The regulatory environment has become increasingly fragmented across geographies. Abundant hydrocarbon feedstocks, integrated refinery-petrochemical complexes, and export-oriented infrastructure provide structural cost advantages that support both commodity and higher-value chemical chains. In Saudi Arabia, the National Industry Strategy targets a fourfold increase in downstream chemical output by 2035, signaling a shift from base petrochemical exports toward specialty materials, performance polymers, and conversion industries.
Competitive Analysis- Intensity of Competition and Market Share
Companies are increasing R&D expenditures by 2-3% while high-intensity segments are witnessing an 8-9% increase in expenditure. The global Physical Vapor Deposition Market industry is characterized by intense competition with companies focusing on profit margins through widening end-user applications. Leading companies, including Applied Materials, Inc., Oerlikon Balzers (Oerlikon Group), Lam Research Corporation, ULVAC, Inc., Veeco Instruments Inc., IHI Ionbond AG, Bühler Leybold Optics, Kobe Steel, Ltd. (Kobelco), Advanced Energy Industries, Inc., Singulus Technologies AG, are analyzed in the study. For each company, a detailed business description, SWOT profile, and products and services benchmarking are provided.
Physical Vapor Deposition Market Market Segmentation
By Technology
Sputter Deposition
Evaporation Deposition
Cathodic Arc Deposition
Pulsed Laser Deposition (PLD)
HiPIMS
By Service Type
PVD Equipment
PVD Materials
PVD Services
By End-Use Industry
Semiconductor & Electronics
Cutting Tools
Solar Products
Medical Devices
Decorative Coatings
Top companies in the Physical Vapor Deposition Market industry
Applied Materials Inc.
Oerlikon Balzers (Oerlikon Group)
Lam Research Corporation
ULVAC Inc.
Veeco Instruments Inc.
IHI Ionbond AG
Bühler Leybold Optics
Kobe Steel Ltd. (Kobelco)
Advanced Energy Industries Inc.
Singulus Technologies AG
Countries Included-
-
North America- US, Canada, Mexico
-
Europe- Germany, France, UK, Spain, Italy, Nordics, Others
-
Asia Pacific- China, India, Japan, South Korea, Australia, Southeast Asia, Others
-
Latin America- Brazil, Argentina, Others
-
Middle East and Africa- Saudi Arabia, UAE, Other Middle East, South Africa, Other Africa
Latest Market Updates In Chemicals
Support this report with fresh, same-industry updates that strengthen topical depth and internal linking.
By Product
Thermal Evaporation
Sputter Deposition
Arc Vapor Deposition
By Application
Semiconductor & Electronics
Solar Products
Cutting Tools
Medical Equipment
Others