Non ferrous Scrap Recycling Market Snapshot: Market Size, CAGR, and Growth Outlook to 2032
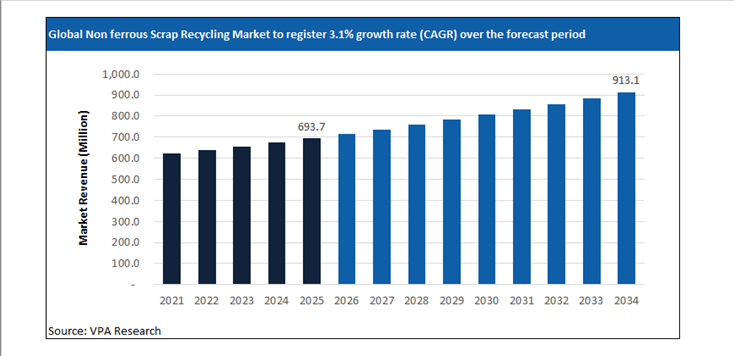
Global Non-ferrous Scrap Recycling Market Size is projected to hit $913.1 Million in 2034 at a CAGR of 3.1% from $693.7 Million Million in 2025.
The report analyzes the global Non ferrous Scrap Recycling Market across diverse segments including By Metal Family (Aluminum, Copper, Lead, Zinc, Nickel & Tin, Precious Metals), By Scrap Source (Industrial Scrap, Consumer / Post-Consumer Scrap, Construction & Demolition Waste, Transportation), By Processing Route (Mechanical Processing, Pyrometallurgical Recycling, Hydrometallurgical Recovery, Electro-Refining), By End-Use Industry (Automotive, Building & Construction, Electrical & Electronics, Packaging).
The Non-ferrous Scrap Recycling Market Market at a Glance (2026)
Quality Arbitrage, Pre-Processing Control, and the Repricing of Contamination Risk
The Non-ferrous Scrap Recycling Market, 2026 is governed by quality arbitrage rather than collection volume. Aluminum, copper, brass, and specialty alloy scrap are abundant, yet usable yield is constrained by contamination, alloy mixing, and inconsistent pre-processing. The economic center of gravity has shifted upstream toward shredding, sorting, and melt-ready preparation where impurity control determines realizable margins. As downstream consumers tighten chemistry windows to protect furnaces and meet customer specifications, scrap streams that once cleared now incur penalties or are excluded outright.
In January 2025, Novelis expanded closed-loop recycling capacity in North America to secure can-to-can feedstock with known alloy chemistry. This move illustrates a broader pattern: producers are locking in homogenous scrap streams to avoid exposure to mixed-grade inputs whose contamination risk cannot be priced reliably. Similar dynamics are visible in copper, where trace elements increasingly determine acceptance.
Energy Exposure, Regional Trade Friction, and Furnace Economics
Energy intensity has re-entered scrap pricing via melting economics. While recycling retains a structural energy advantage over primary smelting, power volatility and grid reliability now influence plant utilization and bid discipline. In February 2025, Aurubis outlined power-hedging and operational flexibility measures across European smelters, underscoring that energy strategy is now inseparable from scrap procurement. Facilities with captive power or long-term contracts can absorb lower-grade scrap; others cannot.
Trade friction compounds the issue. Export controls, inspection regimes, and shipment delays change the relative value of domestic versus imported scrap. In March 2025, Ministry of Commerce updated import inspection requirements for non-ferrous scrap, extending clearance timelines and favoring pre-processed consignments. The effect is not reduced demand but repricing toward higher-prepared scrap, reinforcing investment in upstream processing.
Traceability Mandates, Digital Sorting, and Competitive Structure
Traceability has become a procurement gate rather than a sustainability add-on. Automotive and electrical OEMs require auditable recycled content with chemistry consistency to protect warranties and regulatory disclosures. In April 2025, Hydro expanded digital scrap tracking across European operations, linking bale identity to melt outcomes. This data loop increases acceptance certainty and shifts bargaining power toward processors with verifiable inputs.
Technology adoption is uneven but decisive. Advanced sensor-based sorting and AI-assisted classification raise yields but demand capital and throughput scale. In May 2025, Sims Limited announced upgrades to automated sorting in the United Kingdom, targeting tighter alloy separation for aluminum and copper streams. These investments do not expand collection; they monetize quality.
Progressing through 2026, the Non-ferrous Scrap Recycling Market is defined by contamination risk pricing, energy exposure, and traceability enforcement. Competitive advantage accrues to operators that control pre-processing, secure energy, and provide chemistry assurance. Volume alone no longer clears the market; melt-ready certainty does.
Global Non-ferrous Scrap Recycling Market Market Dynamics: Growth Drivers, Restraints, and Opportunities
Strategic Market Drivers: What’s Fueling Growth in 2026?
The Non-ferrous Scrap Recycling Market market report provides a comprehensive assessment of the structural and technical factors shaping the market’s evolution in 2026 and beyond. It evaluates demand-side shifts, supply-side constraints, regulatory influences, and technology-led disruption impacting both established players and new market entrants. The Non-ferrous Scrap Recycling Market market analysis details the impact of changing end-use requirements, evolving customer specifications, and increasing performance expectations across countries. Further, key drivers and opportunities are mapped across regional and application-level dynamics.
Profit Prioritization and Portfolio Rebalancing
-
Asset Rationalization: Tier 1 players are aggressively divesting low-margin, commoditized assets to reallocate capital toward high-purity, differentiated offerings with superior pricing power.
-
Operating Leverage: Amidst persistent raw material volatility, companies are leveraging Digital Twins and AI-driven manufacturing to optimize OpEx.
-
Specialty Transition: Strategic investments are now concentrated in high-growth niches where customized formulations and technical barriers to entry protect EBITDA margins from global overcapacity in basic chemicals.
A Deep Dive into Emerging Market Hubs
Rapid economic growth, coupled with demand for Non-ferrous Scrap Recycling Market are driving the investment focus on these markets. In particular, India, China, Southeast Asia, Brazil, Eastern Europe, and Latin American markets are registering higher than the global average growth rate. The urban population is expected to reach 6 billion by 2045, around 1.3 times the surge from 2023 levels. Rapid industrialization, infrastructure development, urbanization, and expanding domestic consumption are driving above-average demand growth across markets. Leading Non-ferrous Scrap Recycling Market companies are accelerating investments in local manufacturing, regional supply chains, and application-specific product development to capture these opportunities.
Emerging Opportunities: Untapped High-Growth Niches in the Post-Pandemic Recovery
The post-pandemic landscape for the chemical industry shifted from crisis management to strategic opportunity. In 2026, leading companies are focused on supply chain regionalization, the hygiene-sustainability nexus, and the digital leap in R&D. The Non-ferrous Scrap Recycling Market market is witnessing the emergence of niche, high-growth segments driven by evolving customer needs and regulatory drive. Demand for customized formulations, performance-enhancing solutions, and application-specific variants is rising across advanced manufacturing, specialty end-use industries, and sustainability-led applications. The report identifies underpenetrated segments where innovation, technical differentiation, and faster go-to-market strategies can unlock disproportionate value.
Non-ferrous Scrap Recycling Market Market Challenge- Impact of Geopolitical Uncertainty on Market Stability
In 2026, geopolitical risk has become a structural variable shaping the Non-ferrous Scrap Recycling Market market rather than a short-term disruption factor. Ongoing trade realignments between the U.S., China, and the EU, coupled with sanctions regimes, export controls, and industrial policy interventions, are directly influencing sourcing strategies, production footprints, and pricing stability across the Non-ferrous Scrap Recycling Market value chain. Regional disparities in energy pricing, port congestion risks, and shipping route instability are creating uneven cost structures among global Non-ferrous Scrap Recycling Market producers. Accordingly, Non-ferrous Scrap Recycling Market companies with regionally diversified production assets and localized supplier ecosystems are demonstrating higher margin stability compared to export-reliant peers.
Non-ferrous Scrap Recycling Market Market Strategic Assessment: SWOT, Five Forces, and Value Chain Analysis
Scenario analysis
Amidst varying regulations, trade patterns, supply chain dynamics, and market dynamics, the scenario analysis allows firms to stress-test their current business models. The chapter provides three distinct ‘What-If’ pathways for the Non-ferrous Scrap Recycling Market market through 2032- high growth, low growth, and reference cases. The detailed forward-looking assessment ensures that strategic decisions made today remain viable across a range of potential economic and regulatory outcomes.
Value Chain Analysis
The report identifies key players across the Non-ferrous Scrap Recycling Market industry value chain, tracing the flow from procurement to end-user. By understanding supplier dependencies, processing intensity, distribution dynamics, and customer power at each stage, stakeholders can identify opportunities for vertical integration, strategic partnerships, localization, or operational optimization.
Porter’s Five Forces Analysis
The Porter’s Five Forces analysis chapter incorporates quantitative scoring and weighted impact evaluation for each competitive force within the Non-ferrous Scrap Recycling Market market. This section helps objectively measure industry attractiveness, margin sustainability, and competitive risk using a standardized analytical framework. Companies can evaluate the bargaining power of suppliers and buyers, the threat of substitutes and new entrants, and the degree of rivalry among existing players.
Market Segmentation: Historical and Projected Market Revenue Forecast
Revenue Growth Strategies for Non-ferrous Scrap Recycling Market Segments
The report provides the Non-ferrous Scrap Recycling Market market size across By Metal Family (Aluminum, Copper, Lead, Zinc, Nickel & Tin, Precious Metals), By Scrap Source (Industrial Scrap, Consumer / Post-Consumer Scrap, Construction & Demolition Waste, Transportation), By Processing Route (Mechanical Processing, Pyrometallurgical Recycling, Hydrometallurgical Recovery, Electro-Refining), By End-Use Industry (Automotive, Building & Construction, Electrical & Electronics, Packaging). Market size outlook across the segments is provided at the global, North America, Europe, Asia Pacific, South and Central America, and the Middle East and African regions. Across each segment, the report analyzes the growth prospects, post-pandemic recovery, and country-specific dynamics.
Regional Outlook for Non-ferrous Scrap Recycling Market Manufacturers
United States Non-ferrous Scrap Recycling Market Market Size and Share Analysis- Evolving Trade Policies and Supply Chain Reshuffling
The United States Non-ferrous Scrap Recycling Market market is being reshaped by evolving trade policies, industrial localization initiatives, and a reconfiguration of global supply chains. The outlook for 2026 is moderately higher relative to 2025, driven by policy-driven sourcing decisions, domestic manufacturing incentives, and strategic supplier realignment.
Global GDP forecasts fell to 3.0% in 2025 and 3.1% in 2026, with US growth slowing to 1.8% and 1.4%, respectively. Tariffs on critical intermediates have added around 0.5 percentage points to core inflation, squeezing the margins of downstream manufacturers. Similarly, an estimated 20% of manufacturers are likely to deploy physical AI to mitigate labor shortages in the US. Over the forecast period, as domestic pricing, margin profiles, and capacity utilization increasingly correlate with U.S.-specific trade exposure, logistics costs, and policy alignment, companies focus significantly on supply-chain optimization.
Canada Non-ferrous Scrap Recycling Market Industry Forecast 2026–2032- Increasing role in North America Supply Chain realignment
Canada’s real GDP growth is projected to average 1.25% to 1.5% in 2026, a modest recovery from the 1.3% growth seen in 2025. Unlike the high-volume commodity focus of previous decades, the current market is driven by high-value specialty segments. Strong end-user demand from Ontario, Alberta, Quebec, British Columbia, and other provinces is shaping the long-term growth strategies. The report analyzes the key market drivers and provides the Canada Non-ferrous Scrap Recycling Market market size outlook over the forecast period to 2032.
Mexico Non-ferrous Scrap Recycling Market - Companies are investing in Nearshoring hubs
Nearshoring into Mexico and Canada is accelerating, with the US-Mexico trade projected to grow by $315 Billion by the end of the decade. The American Chemistry Council (ACC), the National Association of the Chemical Industry of Mexico (ANIQ), and the Chemistry Industry Association of Canada (CIAC) are focusing on renewal and strengthening the USMCA. Geographic proximity to the United States enables just-in-time supply models, making Mexico a strategic production location for downstream chemical derivatives, resin conversion, coatings, adhesives, and formulation-based specialty products.
Germany Continues to Dominate the European Non-ferrous Scrap Recycling Market Industry
German giants are divesting non-core assets and emphasizing specialized applications, technical precision, and high-value customer solutions. For instance, Henkel’s $2.5 billion acquisition of Stahl Holdings in February 2026. Leading Non-ferrous Scrap Recycling Market companies are formulating strategies to mitigate short-term effects, including supply chain disruptions and destocking, and longer-term structural dynamics. Over the long-term future, demand outlook remains steady across key value chains, driving investments in new product launches and widening distribution channels.
UK- Post-Brexit Divergence and Specialized Clusters
The United Kingdom chemical industry in 2026 is shaped by divergent structural forces combining cost pressure with specialization-driven resilience. European natural gas prices remain structurally around 3.5× higher than U.S. levels, constraining energy-intensive bulk chemical economics and accelerating a pivot toward higher-value specialty chemicals, performance materials, and formulation-led production. Industry restructuring across the region is evident, with chemical plant closures in Europe increasing sixfold since 2022, according to Cefic, reinforcing the UK sector’s move away from commodity exposure toward efficiency-focused, technology-enabled operations. At the same time, logistics capacity is expanding, with the UK chemical logistics market growing at roughly 5% annually to reach about $8 billion in 2026, strengthening the country’s role as a storage, distribution, and re-export hub for specialty and regulated chemical flows.
China and India account for over 40% of global demand
China’s Non-ferrous Scrap Recycling Market industry is witnessing rapid capacity expansion, technology-led upgrading, and demand reorientation, with accelerated investment across value chain segments reshaping competitive dynamics. The $1.5 trillion chemical industry remains a primary engine of GDP growth, with a government-mandated target of 5% average annual growth in industrial added value through year-end 2026.
Demand fundamentals are also shifting structurally: by 2030, China and India together are projected to account for 40% of global middle-class consumption, up from less than 10% in 2010, indicating long-term expansion in consumption-driven Non-ferrous Scrap Recycling Market applications. Among end-user markets, Guangdong, Jiangsu, Shandong, Zhejiang, Sichuan, and others are widely focused on by vendors.
India remains a significant outlier with a projected 6.6% GDP growth in 2026, driving a surge in Non-ferrous Scrap Recycling Market demand. The government's $1.4 trillion National Infrastructure Pipeline is a massive driver for the market outlook. The Indian government is expected to expand the Production Linked Incentive (PLI) scheme for specialty chemicals in 2026.
Japan: Maintaining Dominance in High-Performance Segments
Japan’s Non-ferrous Scrap Recycling Market industry in 2026 is concentrated in high-performance, specification-critical segments where technical qualification barriers protect margins. Japan’s chemical sector remains one of the world’s most innovation-dense. In 2026, R&D spending in the sector continues to exceed $2.1 Billion annually, with Tokyo and the Kanto region serving as the global hubs for research. Persistent public-sector funding worth ¥4 trillion has moved capital toward advanced materials. To sustain competitive positioning in the evolving environment, Japanese firms can unlock growth by developing new markets through business model transformation and differentiated customer engagement strategies, reflecting the industry’s shift beyond product-led competition toward solution-oriented value creation.
Southeast Asia: The New Manufacturing Core
Southeast Asia is emerging as a primary manufacturing and chemical production growth zone, supported by industrial policy, infrastructure expansion, and supply chain diversification. Vietnam is advancing sector expansion under its Chemical Industry Development Strategy 2030, targeting average annual industry growth of 10–11% through 2030, with emphasis on petrochemicals, downstream plastics, industrial chemicals, and specialty materials serving electronics, construction, and export manufacturing.
The regional economy continues to be resilient, adapting to the shifting landscape and with momentum varying across countries and sectors. Concurrently, Indonesia is accelerating industrial capacity through its National Medium-Term Development Plan (RPJMN), which includes $414 billion in infrastructure investment, strengthening ports, energy systems, and industrial corridors critical for chemical logistics and processing industries.
Middle East- Rapid Economic Growth Supports Potential Business Expansion Opportunities
The Middle East chemical industry is strengthening its position as a global production and export hub through sustained capital deployment, feedstock integration, and downstream diversification. Between 2023 and the end of 2026, the region is tracking around 160 capital projects valued at more than $55 billion, reflecting continued investment in petrochemicals, polymers, specialty derivatives, and industrial chemicals.
The regulatory environment has become increasingly fragmented across geographies. Abundant hydrocarbon feedstocks, integrated refinery-petrochemical complexes, and export-oriented infrastructure provide structural cost advantages that support both commodity and higher-value chemical chains. In Saudi Arabia, the National Industry Strategy targets a fourfold increase in downstream chemical output by 2035, signaling a shift from base petrochemical exports toward specialty materials, performance polymers, and conversion industries.
Competitive Analysis- Intensity of Competition and Market Share
Companies are increasing R&D expenditures by 2-3% while high-intensity segments are witnessing an 8-9% increase in expenditure. The global Non-ferrous Scrap Recycling Market industry is characterized by intense competition with companies focusing on profit margins through widening end-user applications. Leading companies, including Sims Limited, Aurubis AG, European Metal Recycling (EMR), OmniSource Corporation (Steel Dynamics), Commercial Metals Company (CMC), Gravita India Ltd., Dowa Holdings Co., Ltd., Scholz Recycling GmbH, Huanqing Group, Mital Group, are analyzed in the study. For each company, a detailed business description, SWOT profile, and products and services benchmarking are provided.
Non-ferrous Scrap Recycling Market Market Segmentation
By Metal Family
Aluminum
Copper
Lead
Zinc
Nickel & Tin
Precious Metals
By Scrap Source
Industrial Scrap
Consumer / Post-Consumer Scrap
Construction & Demolition Waste
Transportation
By Processing Route
Mechanical Processing
Pyrometallurgical Recycling
Hydrometallurgical Recovery
Electro-Refining
By End-Use Industry
Automotive
Building & Construction
Electrical & Electronics
Packaging
Top companies in the Non-ferrous Scrap Recycling Market industry
Sims Limited
Aurubis AG
European Metal Recycling (EMR)
OmniSource Corporation (Steel Dynamics)
Commercial Metals Company (CMC)
Gravita India Ltd.
Dowa Holdings Co., Ltd.
Scholz Recycling GmbH
Huanqing Group
Mital Group
Countries Included-
-
North America- US, Canada, Mexico
-
Europe- Germany, France, UK, Spain, Italy, Nordics, Others
-
Asia Pacific- China, India, Japan, South Korea, Australia, Southeast Asia, Others
-
Latin America- Brazil, Argentina, Others
-
Middle East and Africa- Saudi Arabia, UAE, Other Middle East, South Africa, Other Africa
Latest Market Updates In Chemicals
Support this report with fresh, same-industry updates that strengthen topical depth and internal linking.
By Sector
Construction
Automotive
Consumer goods
Industrial goods
By Metal
Aluminum
Copper
Lead
Others