Nanoclays Market Snapshot: Market Size, CAGR, and Growth Outlook to 2032
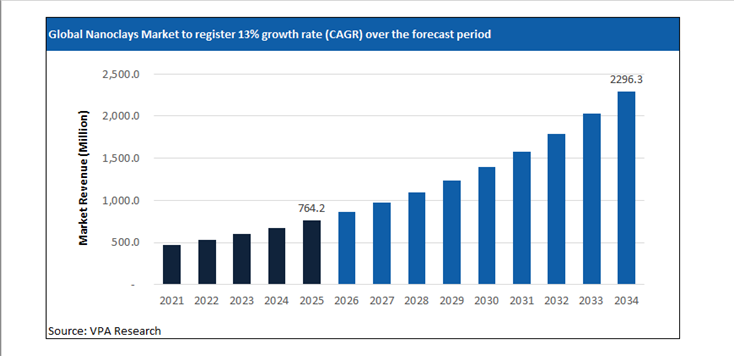
Global Nanoclays Market Size is projected to hit $2295.7 Million in 2034 at a CAGR of 13% from $764.2 Million Million in 2025.
The report analyzes the global Nanoclays Market across diverse segments including By Product Source (Natural Nanoclays, Synthetic Nanoclays), By Form (Powder, Masterbatch, Liquid / Dispersion), By Functionality (Barrier Properties, Flame Retardancy, Mechanical Reinforcement, Rheology Modification), By End-Use Industry (Packaging, Water Treatment, Cosmetics & Personal Care, Paints & Coatings).
The Nanoclays Market Market at a Glance (2026)
Barrier Enhancement, Lightweighting, and Polymer Efficiency Driving the Nanoclays Market
The Nanoclays Market in 2025 is structured around measurable performance enhancement in polymers, coatings, and composites rather than exploratory materials substitution. Nanoclays, primarily layered silicates such as montmorillonite and hectorite, are incorporated at low loadings to deliver improvements in gas barrier resistance, mechanical strength, flame retardancy, and thermal stability. Their value proposition is tied to material efficiency, enabling downgauging and resin reduction while maintaining compliance with functional and regulatory requirements.
Packaging remains a principal application for nanoclay-reinforced polymers, particularly in food and pharmaceutical formats where oxygen and moisture permeability directly affect shelf stability. In January 2025, Amcor confirmed expanded commercial use of nanoclay-enhanced multilayer films in European chilled food packaging, citing improved barrier consistency under extended logistics cycles. This deployment reflects how nanoclays in packaging are being adopted to address operational constraints such as longer distribution distances and reduced preservative usage.
Automotive and transportation materials continue to reinforce demand. Nanoclays are used to improve heat resistance and dimensional stability in interior trims, under-the-hood components, and fuel system parts, supporting lightweighting objectives without compromising durability. In February 2025, Toyota Motor Corporation disclosed broader integration of nanoclay-modified thermoplastics in selected vehicle platforms to meet thermal and emissions-related material specifications. This disclosure underscores how nanoclay reinforcement has transitioned into standardized OEM material strategies.
Dispersion Control, Surface Modification, and Compounding Discipline
Effective dispersion remains the defining technical challenge in the global nanoclays market. Performance gains depend on exfoliation and uniform distribution within polymer matrices, which requires precise surface treatment and controlled compounding. As a result, demand is shifting toward masterbatches and pre-treated nanoclay additives that reduce processing variability for converters and OEMs.
In March 2025, BYK announced the launch of new organo-modified nanoclay grades designed to improve dispersion in polyolefins and engineering plastics. The product launch reflects end-user preference for ready-to-use nanoclays that integrate seamlessly into high-throughput compounding lines without extensive process modification.
Compounders are aligning capital investment with these requirements. In April 2025, BASF confirmed enhancements to polymer compounding operations in Asia to support nanoclay-modified formulations for automotive and industrial customers. These upgrades emphasize tighter process control and consistent exfoliation performance at commercial volumes, reinforcing the industrialization of nanoclays in polymers.
Quality documentation and material traceability are becoming more rigorous as nanoclay-reinforced materials enter regulated applications. Suppliers are providing dispersion metrics, rheological profiles, and long-term performance data to support customer audits and product approvals, increasing entry barriers for lower-tier producers.
Global Nanoclays Market Market Dynamics: Growth Drivers, Restraints, and Opportunities
Strategic Market Drivers: What’s Fueling Growth in 2026?
The Nanoclays Market market report provides a comprehensive assessment of the structural and technical factors shaping the market’s evolution in 2026 and beyond. It evaluates demand-side shifts, supply-side constraints, regulatory influences, and technology-led disruption impacting both established players and new market entrants. The Nanoclays Market market analysis details the impact of changing end-use requirements, evolving customer specifications, and increasing performance expectations across countries. Further, key drivers and opportunities are mapped across regional and application-level dynamics.
Profit Prioritization and Portfolio Rebalancing
-
Asset Rationalization: Tier 1 players are aggressively divesting low-margin, commoditized assets to reallocate capital toward high-purity, differentiated offerings with superior pricing power.
-
Operating Leverage: Amidst persistent raw material volatility, companies are leveraging Digital Twins and AI-driven manufacturing to optimize OpEx.
-
Specialty Transition: Strategic investments are now concentrated in high-growth niches where customized formulations and technical barriers to entry protect EBITDA margins from global overcapacity in basic chemicals.
A Deep Dive into Emerging Market Hubs
Rapid economic growth, coupled with demand for Nanoclays Market are driving the investment focus on these markets. In particular, India, China, Southeast Asia, Brazil, Eastern Europe, and Latin American markets are registering higher than the global average growth rate. The urban population is expected to reach 6 billion by 2045, around 1.3 times the surge from 2023 levels. Rapid industrialization, infrastructure development, urbanization, and expanding domestic consumption are driving above-average demand growth across markets. Leading Nanoclays Market companies are accelerating investments in local manufacturing, regional supply chains, and application-specific product development to capture these opportunities.
Emerging Opportunities: Untapped High-Growth Niches in the Post-Pandemic Recovery
The post-pandemic landscape for the chemical industry shifted from crisis management to strategic opportunity. In 2026, leading companies are focused on supply chain regionalization, the hygiene-sustainability nexus, and the digital leap in R&D. The Nanoclays Market market is witnessing the emergence of niche, high-growth segments driven by evolving customer needs and regulatory drive. Demand for customized formulations, performance-enhancing solutions, and application-specific variants is rising across advanced manufacturing, specialty end-use industries, and sustainability-led applications. The report identifies underpenetrated segments where innovation, technical differentiation, and faster go-to-market strategies can unlock disproportionate value.
Nanoclays Market Market Challenge- Impact of Geopolitical Uncertainty on Market Stability
In 2026, geopolitical risk has become a structural variable shaping the Nanoclays Market market rather than a short-term disruption factor. Ongoing trade realignments between the U.S., China, and the EU, coupled with sanctions regimes, export controls, and industrial policy interventions, are directly influencing sourcing strategies, production footprints, and pricing stability across the Nanoclays Market value chain. Regional disparities in energy pricing, port congestion risks, and shipping route instability are creating uneven cost structures among global Nanoclays Market producers. Accordingly, Nanoclays Market companies with regionally diversified production assets and localized supplier ecosystems are demonstrating higher margin stability compared to export-reliant peers.
Nanoclays Market Market Strategic Assessment: SWOT, Five Forces, and Value Chain Analysis
Scenario analysis
Amidst varying regulations, trade patterns, supply chain dynamics, and market dynamics, the scenario analysis allows firms to stress-test their current business models. The chapter provides three distinct ‘What-If’ pathways for the Nanoclays Market market through 2032- high growth, low growth, and reference cases. The detailed forward-looking assessment ensures that strategic decisions made today remain viable across a range of potential economic and regulatory outcomes.
Value Chain Analysis
The report identifies key players across the Nanoclays Market industry value chain, tracing the flow from procurement to end-user. By understanding supplier dependencies, processing intensity, distribution dynamics, and customer power at each stage, stakeholders can identify opportunities for vertical integration, strategic partnerships, localization, or operational optimization.
Porter’s Five Forces Analysis
The Porter’s Five Forces analysis chapter incorporates quantitative scoring and weighted impact evaluation for each competitive force within the Nanoclays Market market. This section helps objectively measure industry attractiveness, margin sustainability, and competitive risk using a standardized analytical framework. Companies can evaluate the bargaining power of suppliers and buyers, the threat of substitutes and new entrants, and the degree of rivalry among existing players.
Market Segmentation: Historical and Projected Market Revenue Forecast
Revenue Growth Strategies for Nanoclays Market Segments
The report provides the Nanoclays Market market size across By Product Source (Natural Nanoclays, Synthetic Nanoclays), By Form (Powder, Masterbatch, Liquid / Dispersion), By Functionality (Barrier Properties, Flame Retardancy, Mechanical Reinforcement, Rheology Modification), By End-Use Industry (Packaging, Water Treatment, Cosmetics & Personal Care, Paints & Coatings). Market size outlook across the segments is provided at the global, North America, Europe, Asia Pacific, South and Central America, and the Middle East and African regions. Across each segment, the report analyzes the growth prospects, post-pandemic recovery, and country-specific dynamics.
Regional Outlook for Nanoclays Market Manufacturers
United States Nanoclays Market Market Size and Share Analysis- Evolving Trade Policies and Supply Chain Reshuffling
The United States Nanoclays Market market is being reshaped by evolving trade policies, industrial localization initiatives, and a reconfiguration of global supply chains. The outlook for 2026 is moderately higher relative to 2025, driven by policy-driven sourcing decisions, domestic manufacturing incentives, and strategic supplier realignment.
Global GDP forecasts fell to 3.0% in 2025 and 3.1% in 2026, with US growth slowing to 1.8% and 1.4%, respectively. Tariffs on critical intermediates have added around 0.5 percentage points to core inflation, squeezing the margins of downstream manufacturers. Similarly, an estimated 20% of manufacturers are likely to deploy physical AI to mitigate labor shortages in the US. Over the forecast period, as domestic pricing, margin profiles, and capacity utilization increasingly correlate with U.S.-specific trade exposure, logistics costs, and policy alignment, companies focus significantly on supply-chain optimization.
Canada Nanoclays Market Industry Forecast 2026–2032- Increasing role in North America Supply Chain realignment
Canada’s real GDP growth is projected to average 1.25% to 1.5% in 2026, a modest recovery from the 1.3% growth seen in 2025. Unlike the high-volume commodity focus of previous decades, the current market is driven by high-value specialty segments. Strong end-user demand from Ontario, Alberta, Quebec, British Columbia, and other provinces is shaping the long-term growth strategies. The report analyzes the key market drivers and provides the Canada Nanoclays Market market size outlook over the forecast period to 2032.
Mexico Nanoclays Market - Companies are investing in Nearshoring hubs
Nearshoring into Mexico and Canada is accelerating, with the US-Mexico trade projected to grow by $315 Billion by the end of the decade. The American Chemistry Council (ACC), the National Association of the Chemical Industry of Mexico (ANIQ), and the Chemistry Industry Association of Canada (CIAC) are focusing on renewal and strengthening the USMCA. Geographic proximity to the United States enables just-in-time supply models, making Mexico a strategic production location for downstream chemical derivatives, resin conversion, coatings, adhesives, and formulation-based specialty products.
Germany Continues to Dominate the European Nanoclays Market Industry
German giants are divesting non-core assets and emphasizing specialized applications, technical precision, and high-value customer solutions. For instance, Henkel’s $2.5 billion acquisition of Stahl Holdings in February 2026. Leading Nanoclays Market companies are formulating strategies to mitigate short-term effects, including supply chain disruptions and destocking, and longer-term structural dynamics. Over the long-term future, demand outlook remains steady across key value chains, driving investments in new product launches and widening distribution channels.
UK- Post-Brexit Divergence and Specialized Clusters
The United Kingdom chemical industry in 2026 is shaped by divergent structural forces combining cost pressure with specialization-driven resilience. European natural gas prices remain structurally around 3.5× higher than U.S. levels, constraining energy-intensive bulk chemical economics and accelerating a pivot toward higher-value specialty chemicals, performance materials, and formulation-led production. Industry restructuring across the region is evident, with chemical plant closures in Europe increasing sixfold since 2022, according to Cefic, reinforcing the UK sector’s move away from commodity exposure toward efficiency-focused, technology-enabled operations. At the same time, logistics capacity is expanding, with the UK chemical logistics market growing at roughly 5% annually to reach about $8 billion in 2026, strengthening the country’s role as a storage, distribution, and re-export hub for specialty and regulated chemical flows.
China and India account for over 40% of global demand
China’s Nanoclays Market industry is witnessing rapid capacity expansion, technology-led upgrading, and demand reorientation, with accelerated investment across value chain segments reshaping competitive dynamics. The $1.5 trillion chemical industry remains a primary engine of GDP growth, with a government-mandated target of 5% average annual growth in industrial added value through year-end 2026.
Demand fundamentals are also shifting structurally: by 2030, China and India together are projected to account for 40% of global middle-class consumption, up from less than 10% in 2010, indicating long-term expansion in consumption-driven Nanoclays Market applications. Among end-user markets, Guangdong, Jiangsu, Shandong, Zhejiang, Sichuan, and others are widely focused on by vendors.
India remains a significant outlier with a projected 6.6% GDP growth in 2026, driving a surge in Nanoclays Market demand. The government's $1.4 trillion National Infrastructure Pipeline is a massive driver for the market outlook. The Indian government is expected to expand the Production Linked Incentive (PLI) scheme for specialty chemicals in 2026.
Japan: Maintaining Dominance in High-Performance Segments
Japan’s Nanoclays Market industry in 2026 is concentrated in high-performance, specification-critical segments where technical qualification barriers protect margins. Japan’s chemical sector remains one of the world’s most innovation-dense. In 2026, R&D spending in the sector continues to exceed $2.1 Billion annually, with Tokyo and the Kanto region serving as the global hubs for research. Persistent public-sector funding worth ¥4 trillion has moved capital toward advanced materials. To sustain competitive positioning in the evolving environment, Japanese firms can unlock growth by developing new markets through business model transformation and differentiated customer engagement strategies, reflecting the industry’s shift beyond product-led competition toward solution-oriented value creation.
Southeast Asia: The New Manufacturing Core
Southeast Asia is emerging as a primary manufacturing and chemical production growth zone, supported by industrial policy, infrastructure expansion, and supply chain diversification. Vietnam is advancing sector expansion under its Chemical Industry Development Strategy 2030, targeting average annual industry growth of 10–11% through 2030, with emphasis on petrochemicals, downstream plastics, industrial chemicals, and specialty materials serving electronics, construction, and export manufacturing.
The regional economy continues to be resilient, adapting to the shifting landscape and with momentum varying across countries and sectors. Concurrently, Indonesia is accelerating industrial capacity through its National Medium-Term Development Plan (RPJMN), which includes $414 billion in infrastructure investment, strengthening ports, energy systems, and industrial corridors critical for chemical logistics and processing industries.
Middle East- Rapid Economic Growth Supports Potential Business Expansion Opportunities
The Middle East chemical industry is strengthening its position as a global production and export hub through sustained capital deployment, feedstock integration, and downstream diversification. Between 2023 and the end of 2026, the region is tracking around 160 capital projects valued at more than $55 billion, reflecting continued investment in petrochemicals, polymers, specialty derivatives, and industrial chemicals.
The regulatory environment has become increasingly fragmented across geographies. Abundant hydrocarbon feedstocks, integrated refinery-petrochemical complexes, and export-oriented infrastructure provide structural cost advantages that support both commodity and higher-value chemical chains. In Saudi Arabia, the National Industry Strategy targets a fourfold increase in downstream chemical output by 2035, signaling a shift from base petrochemical exports toward specialty materials, performance polymers, and conversion industries.
Competitive Analysis- Intensity of Competition and Market Share
Companies are increasing R&D expenditures by 2-3% while high-intensity segments are witnessing an 8-9% increase in expenditure. The global Nanoclays Market industry is characterized by intense competition with companies focusing on profit margins through widening end-user applications. Leading companies, including Mineral Technologies Inc., Elementis PLC, BYK Additives & Instruments, Kunimine Industries Co., Ltd., UBE Corporation, Kowa Company, Ltd., StatNano, Techmer PM, Sun Chemical (DIC Corporation), Attogene, are analyzed in the study. For each company, a detailed business description, SWOT profile, and products and services benchmarking are provided.
Nanoclays Market Market Segmentation
By Product Source
Natural Nanoclays
Synthetic Nanoclays
By Form
Powder
Masterbatch
Liquid / Dispersion
By Functionality
Barrier Properties
Flame Retardancy
Mechanical Reinforcement
Rheology Modification
By End-Use Industry
Packaging
Water Treatment
Cosmetics & Personal Care
Paints & Coatings
Top companies in the Nanoclays Market industry
Mineral Technologies Inc.
Elementis PLC
BYK Additives & Instruments
Kunimine Industries Co., Ltd.
UBE Corporation
Kowa Company, Ltd.
StatNano
Techmer PM
Sun Chemical (DIC Corporation)
Attogene
Countries Included-
-
North America- US, Canada, Mexico
-
Europe- Germany, France, UK, Spain, Italy, Nordics, Others
-
Asia Pacific- China, India, Japan, South Korea, Australia, Southeast Asia, Others
-
Latin America- Brazil, Argentina, Others
-
Middle East and Africa- Saudi Arabia, UAE, Other Middle East, South Africa, Other Africa
Latest Market Updates In Chemicals
Support this report with fresh, same-industry updates that strengthen topical depth and internal linking.
Low MOQ, High-Mix Production Models for Indie & DTC Brands
The rising geopolitical and tariff-related uncertainties, in particular, amidst United States’ renewed protectionist trade stance continues to driv...
Market UpdateRise of Functional and Clinical-Grade Skincare
The rising geopolitical and tariff-related uncertainties, in particular, amidst United States’ renewed protectionist trade stance continues to driv...
By Product
Montmorillonite
Kaolinite
Smectite
Others
By Application
Water Treatment
Food and Beverage
Automotive
Biomedical
Paints and Coatings
Others