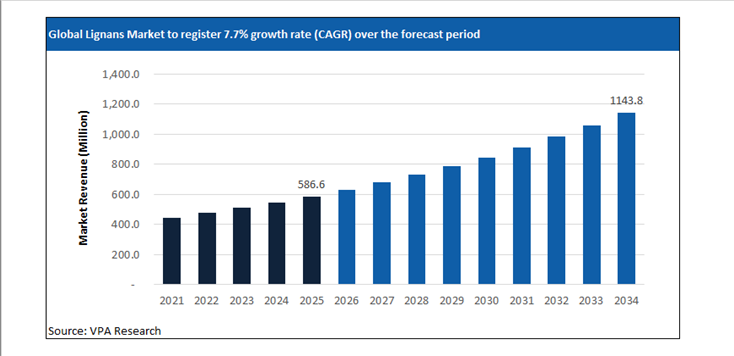
Lignans Market Snapshot: Market Size, CAGR, and Growth Outlook to 2032
Global Lignans Market Size is projected to hit $1143.6 Million in 2034 at a CAGR of 7.7% from $586.6 Million Million in 2025.
The report analyzes the global Lignans Market across diverse segments including By Source (Oilseeds, Cereals & Grains, Plant Resins, Fruits & Vegetables), By Application (Food & Beverages, Dietary Supplements, Pharmaceuticals, Cosmetics & Toiletries, Animal Nutrition), By Distribution Channel (Direct Sales, Online Retail, Offline Retail).
The Lignans Market Market at a Glance (2026)
Phytochemical Standardization, Clinical Positioning, and Supply Traceability
The lignans market sits at the intersection of nutraceuticals, functional foods, and specialty pharmaceuticals, with demand anchored in plant-derived polyphenols such as secoisolariciresinol diglucoside (SDG), matairesinol, and enterolactone precursors. Commercial relevance is defined less by volume throughput and more by standardization, bioavailability, and clinical positioning. Buyers increasingly specify assay-verified lignan content, impurity profiles, and solvent residues, reflecting regulatory scrutiny across supplements and medical nutrition.
In 2025, regulatory posture tightened across key consuming regions. The European Food Safety Authority reinforced evidence thresholds for health claims linked to phytoestrogens, including lignans, prompting brand owners to reformulate toward well-characterized flaxseed-derived lignan complexes with reproducible pharmacokinetics. This policy shift favored ingredient suppliers able to document conversion pathways to enterolignans in vivo, shifting competition toward science-backed extracts rather than commodity powders.
Extraction Technologies, Bioavailability Enhancement, and IP Density
Technology differentiation in the lignans market centers on extraction selectivity and downstream modification. Enzymatic hydrolysis, membrane filtration, and solvent optimization are deployed to concentrate SDG while preserving matrix integrity. In 2025, Archer Daniels Midland expanded pilot-scale capabilities for flaxseed fractionation in North America, aligning lignan extraction with protein and fiber coproduct streams to improve yield economics and traceability. This integration reduced batch variability and supported contract manufacturing for nutraceutical brands.
Bioavailability remains a decisive constraint. Several suppliers pursued microencapsulation and lipid carrier systems to stabilize lignans through processing and digestion. In Japan, Kikkoman announced a 2025 collaboration with academic partners to study lignan metabolism within fermented matrices, aiming to improve enterolactone conversion consistency. Such initiatives reflect a broader pivot from raw-content marketing toward functional efficacy, raising intellectual property density and barriers to entry.
Geographic Sourcing, Sustainability Credentials, and Demand Resilience
Flaxseed dominates lignan sourcing, tying the market to agricultural traceability in Canada, Northern Europe, and parts of Asia. In 2025, Canadian processors emphasized identity-preserved supply chains and non-GMO certification to meet premium supplement requirements. Sustainability credentials, including solvent recovery and coproduct valorization, increasingly influence supplier selection, particularly for multinational brands subject to ESG audits.
The lignans market exhibits demand resilience due to its positioning in women’s health, cardiovascular support, and metabolic wellness portfolios. Replacement risk is mitigated by the difficulty of substituting standardized lignan complexes with synthetic analogs without reformulation and regulatory reapproval, reinforcing long product lifecycles for qualified suppliers.
Global Lignans Market Market Dynamics: Growth Drivers, Restraints, and Opportunities
Strategic Market Drivers: What’s Fueling Growth in 2026?
The Lignans Market market report provides a comprehensive assessment of the structural and technical factors shaping the market’s evolution in 2026 and beyond. It evaluates demand-side shifts, supply-side constraints, regulatory influences, and technology-led disruption impacting both established players and new market entrants. The Lignans Market market analysis details the impact of changing end-use requirements, evolving customer specifications, and increasing performance expectations across countries. Further, key drivers and opportunities are mapped across regional and application-level dynamics.
Profit Prioritization and Portfolio Rebalancing
-
Asset Rationalization: Tier 1 players are aggressively divesting low-margin, commoditized assets to reallocate capital toward high-purity, differentiated offerings with superior pricing power.
-
Operating Leverage: Amidst persistent raw material volatility, companies are leveraging Digital Twins and AI-driven manufacturing to optimize OpEx.
-
Specialty Transition: Strategic investments are now concentrated in high-growth niches where customized formulations and technical barriers to entry protect EBITDA margins from global overcapacity in basic chemicals.
A Deep Dive into Emerging Market Hubs
Rapid economic growth, coupled with demand for Lignans Market are driving the investment focus on these markets. In particular, India, China, Southeast Asia, Brazil, Eastern Europe, and Latin American markets are registering higher than the global average growth rate. The urban population is expected to reach 6 billion by 2045, around 1.3 times the surge from 2023 levels. Rapid industrialization, infrastructure development, urbanization, and expanding domestic consumption are driving above-average demand growth across markets. Leading Lignans Market companies are accelerating investments in local manufacturing, regional supply chains, and application-specific product development to capture these opportunities.
Emerging Opportunities: Untapped High-Growth Niches in the Post-Pandemic Recovery
The post-pandemic landscape for the chemical industry shifted from crisis management to strategic opportunity. In 2026, leading companies are focused on supply chain regionalization, the hygiene-sustainability nexus, and the digital leap in R&D. The Lignans Market market is witnessing the emergence of niche, high-growth segments driven by evolving customer needs and regulatory drive. Demand for customized formulations, performance-enhancing solutions, and application-specific variants is rising across advanced manufacturing, specialty end-use industries, and sustainability-led applications. The report identifies underpenetrated segments where innovation, technical differentiation, and faster go-to-market strategies can unlock disproportionate value.
Lignans Market Market Challenge- Impact of Geopolitical Uncertainty on Market Stability
In 2026, geopolitical risk has become a structural variable shaping the Lignans Market market rather than a short-term disruption factor. Ongoing trade realignments between the U.S., China, and the EU, coupled with sanctions regimes, export controls, and industrial policy interventions, are directly influencing sourcing strategies, production footprints, and pricing stability across the Lignans Market value chain. Regional disparities in energy pricing, port congestion risks, and shipping route instability are creating uneven cost structures among global Lignans Market producers. Accordingly, Lignans Market companies with regionally diversified production assets and localized supplier ecosystems are demonstrating higher margin stability compared to export-reliant peers.
Lignans Market Market Strategic Assessment: SWOT, Five Forces, and Value Chain Analysis
Scenario analysis
Amidst varying regulations, trade patterns, supply chain dynamics, and market dynamics, the scenario analysis allows firms to stress-test their current business models. The chapter provides three distinct ‘What-If’ pathways for the Lignans Market market through 2032- high growth, low growth, and reference cases. The detailed forward-looking assessment ensures that strategic decisions made today remain viable across a range of potential economic and regulatory outcomes.
Value Chain Analysis
The report identifies key players across the Lignans Market industry value chain, tracing the flow from procurement to end-user. By understanding supplier dependencies, processing intensity, distribution dynamics, and customer power at each stage, stakeholders can identify opportunities for vertical integration, strategic partnerships, localization, or operational optimization.
Porter’s Five Forces Analysis
The Porter’s Five Forces analysis chapter incorporates quantitative scoring and weighted impact evaluation for each competitive force within the Lignans Market market. This section helps objectively measure industry attractiveness, margin sustainability, and competitive risk using a standardized analytical framework. Companies can evaluate the bargaining power of suppliers and buyers, the threat of substitutes and new entrants, and the degree of rivalry among existing players.
Market Segmentation: Historical and Projected Market Revenue Forecast
Revenue Growth Strategies for Lignans Market Segments
The report provides the Lignans Market market size across By Source (Oilseeds, Cereals & Grains, Plant Resins, Fruits & Vegetables), By Application (Food & Beverages, Dietary Supplements, Pharmaceuticals, Cosmetics & Toiletries, Animal Nutrition), By Distribution Channel (Direct Sales, Online Retail, Offline Retail). Market size outlook across the segments is provided at the global, North America, Europe, Asia Pacific, South and Central America, and the Middle East and African regions. Across each segment, the report analyzes the growth prospects, post-pandemic recovery, and country-specific dynamics.
Regional Outlook for Lignans Market Manufacturers
United States Lignans Market Market Size and Share Analysis- Evolving Trade Policies and Supply Chain Reshuffling
The United States Lignans Market market is being reshaped by evolving trade policies, industrial localization initiatives, and a reconfiguration of global supply chains. The outlook for 2026 is moderately higher relative to 2025, driven by policy-driven sourcing decisions, domestic manufacturing incentives, and strategic supplier realignment.
Global GDP forecasts fell to 3.0% in 2025 and 3.1% in 2026, with US growth slowing to 1.8% and 1.4%, respectively. Tariffs on critical intermediates have added around 0.5 percentage points to core inflation, squeezing the margins of downstream manufacturers. Similarly, an estimated 20% of manufacturers are likely to deploy physical AI to mitigate labor shortages in the US. Over the forecast period, as domestic pricing, margin profiles, and capacity utilization increasingly correlate with U.S.-specific trade exposure, logistics costs, and policy alignment, companies focus significantly on supply-chain optimization.
Canada Lignans Market Industry Forecast 2026–2032- Increasing role in North America Supply Chain realignment
Canada’s real GDP growth is projected to average 1.25% to 1.5% in 2026, a modest recovery from the 1.3% growth seen in 2025. Unlike the high-volume commodity focus of previous decades, the current market is driven by high-value specialty segments. Strong end-user demand from Ontario, Alberta, Quebec, British Columbia, and other provinces is shaping the long-term growth strategies. The report analyzes the key market drivers and provides the Canada Lignans Market market size outlook over the forecast period to 2032.
Mexico Lignans Market - Companies are investing in Nearshoring hubs
Nearshoring into Mexico and Canada is accelerating, with the US-Mexico trade projected to grow by $315 Billion by the end of the decade. The American Chemistry Council (ACC), the National Association of the Chemical Industry of Mexico (ANIQ), and the Chemistry Industry Association of Canada (CIAC) are focusing on renewal and strengthening the USMCA. Geographic proximity to the United States enables just-in-time supply models, making Mexico a strategic production location for downstream chemical derivatives, resin conversion, coatings, adhesives, and formulation-based specialty products.
Germany Continues to Dominate the European Lignans Market Industry
German giants are divesting non-core assets and emphasizing specialized applications, technical precision, and high-value customer solutions. For instance, Henkel’s $2.5 billion acquisition of Stahl Holdings in February 2026. Leading Lignans Market companies are formulating strategies to mitigate short-term effects, including supply chain disruptions and destocking, and longer-term structural dynamics. Over the long-term future, demand outlook remains steady across key value chains, driving investments in new product launches and widening distribution channels.
UK- Post-Brexit Divergence and Specialized Clusters
The United Kingdom chemical industry in 2026 is shaped by divergent structural forces combining cost pressure with specialization-driven resilience. European natural gas prices remain structurally around 3.5× higher than U.S. levels, constraining energy-intensive bulk chemical economics and accelerating a pivot toward higher-value specialty chemicals, performance materials, and formulation-led production. Industry restructuring across the region is evident, with chemical plant closures in Europe increasing sixfold since 2022, according to Cefic, reinforcing the UK sector’s move away from commodity exposure toward efficiency-focused, technology-enabled operations. At the same time, logistics capacity is expanding, with the UK chemical logistics market growing at roughly 5% annually to reach about $8 billion in 2026, strengthening the country’s role as a storage, distribution, and re-export hub for specialty and regulated chemical flows.
China and India account for over 40% of global demand
China’s Lignans Market industry is witnessing rapid capacity expansion, technology-led upgrading, and demand reorientation, with accelerated investment across value chain segments reshaping competitive dynamics. The $1.5 trillion chemical industry remains a primary engine of GDP growth, with a government-mandated target of 5% average annual growth in industrial added value through year-end 2026.
Demand fundamentals are also shifting structurally: by 2030, China and India together are projected to account for 40% of global middle-class consumption, up from less than 10% in 2010, indicating long-term expansion in consumption-driven Lignans Market applications. Among end-user markets, Guangdong, Jiangsu, Shandong, Zhejiang, Sichuan, and others are widely focused on by vendors.
India remains a significant outlier with a projected 6.6% GDP growth in 2026, driving a surge in Lignans Market demand. The government's $1.4 trillion National Infrastructure Pipeline is a massive driver for the market outlook. The Indian government is expected to expand the Production Linked Incentive (PLI) scheme for specialty chemicals in 2026.
Japan: Maintaining Dominance in High-Performance Segments
Japan’s Lignans Market industry in 2026 is concentrated in high-performance, specification-critical segments where technical qualification barriers protect margins. Japan’s chemical sector remains one of the world’s most innovation-dense. In 2026, R&D spending in the sector continues to exceed $2.1 Billion annually, with Tokyo and the Kanto region serving as the global hubs for research. Persistent public-sector funding worth ¥4 trillion has moved capital toward advanced materials. To sustain competitive positioning in the evolving environment, Japanese firms can unlock growth by developing new markets through business model transformation and differentiated customer engagement strategies, reflecting the industry’s shift beyond product-led competition toward solution-oriented value creation.
Southeast Asia: The New Manufacturing Core
Southeast Asia is emerging as a primary manufacturing and chemical production growth zone, supported by industrial policy, infrastructure expansion, and supply chain diversification. Vietnam is advancing sector expansion under its Chemical Industry Development Strategy 2030, targeting average annual industry growth of 10–11% through 2030, with emphasis on petrochemicals, downstream plastics, industrial chemicals, and specialty materials serving electronics, construction, and export manufacturing.
The regional economy continues to be resilient, adapting to the shifting landscape and with momentum varying across countries and sectors. Concurrently, Indonesia is accelerating industrial capacity through its National Medium-Term Development Plan (RPJMN), which includes $414 billion in infrastructure investment, strengthening ports, energy systems, and industrial corridors critical for chemical logistics and processing industries.
Middle East- Rapid Economic Growth Supports Potential Business Expansion Opportunities
The Middle East chemical industry is strengthening its position as a global production and export hub through sustained capital deployment, feedstock integration, and downstream diversification. Between 2023 and the end of 2026, the region is tracking around 160 capital projects valued at more than $55 billion, reflecting continued investment in petrochemicals, polymers, specialty derivatives, and industrial chemicals.
The regulatory environment has become increasingly fragmented across geographies. Abundant hydrocarbon feedstocks, integrated refinery-petrochemical complexes, and export-oriented infrastructure provide structural cost advantages that support both commodity and higher-value chemical chains. In Saudi Arabia, the National Industry Strategy targets a fourfold increase in downstream chemical output by 2035, signaling a shift from base petrochemical exports toward specialty materials, performance polymers, and conversion industries.
Competitive Analysis- Intensity of Competition and Market Share
Companies are increasing R&D expenditures by 2-3% while high-intensity segments are witnessing an 8-9% increase in expenditure. The global Lignans Market industry is characterized by intense competition with companies focusing on profit margins through widening end-user applications. Leading companies, including Archer Daniels Midland Company (ADM), Naturalin Bio-Resources Co., Ltd., BioGin Biochemicals Co., Ltd., Prairie Tide Diversified Inc., Arjuna Natural Pvt Ltd, Skuny Bioscience Co., Ltd., Kingherbs Limited, Farbest Brands, Hunan NutraMax Inc., Plamed Green Science Group, are analyzed in the study. For each company, a detailed business description, SWOT profile, and products and services benchmarking are provided.
Lignans Market Market Segmentation
By Source
Oilseeds
Cereals & Grains
Plant Resins
Fruits & Vegetables
By Application
Food & Beverages
Dietary Supplements
Pharmaceuticals
Cosmetics & Toiletries
Animal Nutrition
By Distribution Channel
Direct Sales
Online Retail
Offline Retail
Top companies in the Lignans Market industry
Archer Daniels Midland Company (ADM)
Naturalin Bio-Resources Co., Ltd.
BioGin Biochemicals Co., Ltd.
Prairie Tide Diversified Inc.
Arjuna Natural Pvt Ltd
Skuny Bioscience Co., Ltd.
Kingherbs Limited
Farbest Brands
Hunan NutraMax Inc.
Plamed Green Science Group
Countries Included-
-
North America- US, Canada, Mexico
-
Europe- Germany, France, UK, Spain, Italy, Nordics, Others
-
Asia Pacific- China, India, Japan, South Korea, Australia, Southeast Asia, Others
-
Latin America- Brazil, Argentina, Others
-
Middle East and Africa- Saudi Arabia, UAE, Other Middle East, South Africa, Other Africa
Latest Market Updates In Chemicals
Support this report with fresh, same-industry updates that strengthen topical depth and internal linking.
By Source
Oilseeds
Cereals & Grains
Plant Resins
By Application
Food & Beverages
-Functional Food
-Functional Beverages
-Dietary Supplements
-Others
Cosmetics & Toiletries
-Haircare
-Skincare
-Toiletries
-Others
Pharmaceuticals
Animal Nutrition
Others