Inulin Market Snapshot: Market Size, CAGR, and Growth Outlook to 2032
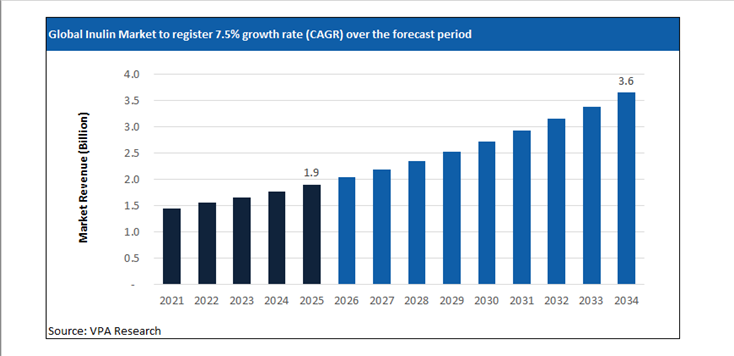
Global Inulin Market Size is projected to hit $3.6 Billion in 2034 at a CAGR of 7.5% from $1.9 Billion Million in 2025.
The report analyzes the global Inulin Market across diverse segments including By Source (Chicory Root, Jerusalem Artichoke, Agave, Garlic, Onion, and Others), By Form (Powder, Liquid / Syrup), By Nature (Conventional, Organic), By Application (Food & Beverages, Dietary Supplements, Pharmaceuticals, Animal Feed, Cosmetics & Personal Care), By Functionality (Sugar & Fat Replacement, Prebiotic/Digestive Health, Texture & Mouthfeel Modification).
The Inulin Market Market at a Glance (2026)
Natural Fructan Chemistry and Functional Fiber Properties Position Inulin as a Multi-Sector Ingredient
Inulin is a naturally occurring polysaccharide classified as a fructan, composed primarily of β-(2→1)-linked fructose units, typically extracted from chicory root, agave, Jerusalem artichoke, and other plant sources. Its unique chemical structure renders it non-digestible in the upper gastrointestinal tract, allowing it to function as a soluble dietary fiber and prebiotic ingredient. This biochemical property underpins inulin’s widespread use in food, beverage, nutraceutical, and pharmaceutical formulations.
In food processing, inulin is used for texture modification, fat replacement, sugar reduction, and fiber fortification. It provides mouthfeel and viscosity similar to fats when hydrated, making it suitable for dairy alternatives, baked goods, spreads, and functional beverages. Its mild sweetness and neutral flavor profile allow incorporation without altering sensory characteristics. Degree of polymerization (DP) is a critical specification, as shorter-chain inulin contributes sweetness while longer-chain variants provide stronger gel-forming properties.
Extraction Technology, Purity Grades, and Functional Differentiation Influence Market Structure
Commercial inulin production involves hot-water extraction from plant roots, followed by purification, filtration, evaporation, and spray drying. Chicory root remains the dominant industrial source due to high inulin content and established agricultural supply chains. Processing parameters influence molecular weight distribution, solubility, and fermentability, resulting in differentiated product grades.
High-performance inulin grades are standardized for DP range, moisture content, and microbial load, particularly for pharmaceutical and infant nutrition applications. In tablet formulations, inulin serves as a binder and filler with prebiotic functionality. In nutraceutical powders, it supports gut microbiota modulation and mineral absorption.
Stability under heat and pH variation allows inulin to withstand common food processing conditions, although excessive thermal exposure can cause hydrolysis into fructose. As a result, application-specific grades are tailored for bakery, dairy, or beverage systems to maintain functional integrity.
Regulatory Recognition, Digestive Health Trends, and Expanding Application Scope Sustain Market Relevance
Inulin is recognized as dietary fiber by multiple food regulatory authorities and is generally regarded as safe (GRAS) in many jurisdictions. Labeling regulations related to fiber content and digestive health claims influence formulation strategies in packaged foods. Rising consumer awareness of gut health, microbiome balance, and sugar reduction has increased incorporation of inulin into everyday food products beyond traditional health supplements.
Beyond food and nutrition, inulin is used in fermentation processes, calcium absorption studies, and controlled-release drug delivery systems due to its biodegradable and fermentable nature. Research into synbiotic formulations combining inulin with probiotics continues to expand its application footprint.
The inulin market is characterized by functional differentiation, plant-based sourcing, and scientifically validated health properties, positioning it as a core ingredient in the evolving functional nutrition and wellness ecosystem.
Global Inulin Market Market Dynamics: Growth Drivers, Restraints, and Opportunities
Strategic Market Drivers: What’s Fueling Growth in 2026?
The Inulin Market market report provides a comprehensive assessment of the structural and technical factors shaping the market’s evolution in 2026 and beyond. It evaluates demand-side shifts, supply-side constraints, regulatory influences, and technology-led disruption impacting both established players and new market entrants. The Inulin Market market analysis details the impact of changing end-use requirements, evolving customer specifications, and increasing performance expectations across countries. Further, key drivers and opportunities are mapped across regional and application-level dynamics.
Profit Prioritization and Portfolio Rebalancing
-
Asset Rationalization: Tier 1 players are aggressively divesting low-margin, commoditized assets to reallocate capital toward high-purity, differentiated offerings with superior pricing power.
-
Operating Leverage: Amidst persistent raw material volatility, companies are leveraging Digital Twins and AI-driven manufacturing to optimize OpEx.
-
Specialty Transition: Strategic investments are now concentrated in high-growth niches where customized formulations and technical barriers to entry protect EBITDA margins from global overcapacity in basic chemicals.
A Deep Dive into Emerging Market Hubs
Rapid economic growth, coupled with demand for Inulin Market are driving the investment focus on these markets. In particular, India, China, Southeast Asia, Brazil, Eastern Europe, and Latin American markets are registering higher than the global average growth rate. The urban population is expected to reach 6 billion by 2045, around 1.3 times the surge from 2023 levels. Rapid industrialization, infrastructure development, urbanization, and expanding domestic consumption are driving above-average demand growth across markets. Leading Inulin Market companies are accelerating investments in local manufacturing, regional supply chains, and application-specific product development to capture these opportunities.
Emerging Opportunities: Untapped High-Growth Niches in the Post-Pandemic Recovery
The post-pandemic landscape for the chemical industry shifted from crisis management to strategic opportunity. In 2026, leading companies are focused on supply chain regionalization, the hygiene-sustainability nexus, and the digital leap in R&D. The Inulin Market market is witnessing the emergence of niche, high-growth segments driven by evolving customer needs and regulatory drive. Demand for customized formulations, performance-enhancing solutions, and application-specific variants is rising across advanced manufacturing, specialty end-use industries, and sustainability-led applications. The report identifies underpenetrated segments where innovation, technical differentiation, and faster go-to-market strategies can unlock disproportionate value.
Inulin Market Market Challenge- Impact of Geopolitical Uncertainty on Market Stability
In 2026, geopolitical risk has become a structural variable shaping the Inulin Market market rather than a short-term disruption factor. Ongoing trade realignments between the U.S., China, and the EU, coupled with sanctions regimes, export controls, and industrial policy interventions, are directly influencing sourcing strategies, production footprints, and pricing stability across the Inulin Market value chain. Regional disparities in energy pricing, port congestion risks, and shipping route instability are creating uneven cost structures among global Inulin Market producers. Accordingly, Inulin Market companies with regionally diversified production assets and localized supplier ecosystems are demonstrating higher margin stability compared to export-reliant peers.
Inulin Market Market Strategic Assessment: SWOT, Five Forces, and Value Chain Analysis
Scenario analysis
Amidst varying regulations, trade patterns, supply chain dynamics, and market dynamics, the scenario analysis allows firms to stress-test their current business models. The chapter provides three distinct ‘What-If’ pathways for the Inulin Market market through 2032- high growth, low growth, and reference cases. The detailed forward-looking assessment ensures that strategic decisions made today remain viable across a range of potential economic and regulatory outcomes.
Value Chain Analysis
The report identifies key players across the Inulin Market industry value chain, tracing the flow from procurement to end-user. By understanding supplier dependencies, processing intensity, distribution dynamics, and customer power at each stage, stakeholders can identify opportunities for vertical integration, strategic partnerships, localization, or operational optimization.
Porter’s Five Forces Analysis
The Porter’s Five Forces analysis chapter incorporates quantitative scoring and weighted impact evaluation for each competitive force within the Inulin Market market. This section helps objectively measure industry attractiveness, margin sustainability, and competitive risk using a standardized analytical framework. Companies can evaluate the bargaining power of suppliers and buyers, the threat of substitutes and new entrants, and the degree of rivalry among existing players.
Market Segmentation: Historical and Projected Market Revenue Forecast
Revenue Growth Strategies for Inulin Market Segments
The report provides the Inulin Market market size across By Source (Chicory Root, Jerusalem Artichoke, Agave, Garlic, Onion, and Others), By Form (Powder, Liquid / Syrup), By Nature (Conventional, Organic), By Application (Food & Beverages, Dietary Supplements, Pharmaceuticals, Animal Feed, Cosmetics & Personal Care), By Functionality (Sugar & Fat Replacement, Prebiotic/Digestive Health, Texture & Mouthfeel Modification). Market size outlook across the segments is provided at the global, North America, Europe, Asia Pacific, South and Central America, and the Middle East and African regions. Across each segment, the report analyzes the growth prospects, post-pandemic recovery, and country-specific dynamics.
Regional Outlook for Inulin Market Manufacturers
United States Inulin Market Market Size and Share Analysis- Evolving Trade Policies and Supply Chain Reshuffling
The United States Inulin Market market is being reshaped by evolving trade policies, industrial localization initiatives, and a reconfiguration of global supply chains. The outlook for 2026 is moderately higher relative to 2025, driven by policy-driven sourcing decisions, domestic manufacturing incentives, and strategic supplier realignment.
Global GDP forecasts fell to 3.0% in 2025 and 3.1% in 2026, with US growth slowing to 1.8% and 1.4%, respectively. Tariffs on critical intermediates have added around 0.5 percentage points to core inflation, squeezing the margins of downstream manufacturers. Similarly, an estimated 20% of manufacturers are likely to deploy physical AI to mitigate labor shortages in the US. Over the forecast period, as domestic pricing, margin profiles, and capacity utilization increasingly correlate with U.S.-specific trade exposure, logistics costs, and policy alignment, companies focus significantly on supply-chain optimization.
Canada Inulin Market Industry Forecast 2026–2032- Increasing role in North America Supply Chain realignment
Canada’s real GDP growth is projected to average 1.25% to 1.5% in 2026, a modest recovery from the 1.3% growth seen in 2025. Unlike the high-volume commodity focus of previous decades, the current market is driven by high-value specialty segments. Strong end-user demand from Ontario, Alberta, Quebec, British Columbia, and other provinces is shaping the long-term growth strategies. The report analyzes the key market drivers and provides the Canada Inulin Market market size outlook over the forecast period to 2032.
Mexico Inulin Market - Companies are investing in Nearshoring hubs
Nearshoring into Mexico and Canada is accelerating, with the US-Mexico trade projected to grow by $315 Billion by the end of the decade. The American Chemistry Council (ACC), the National Association of the Chemical Industry of Mexico (ANIQ), and the Chemistry Industry Association of Canada (CIAC) are focusing on renewal and strengthening the USMCA. Geographic proximity to the United States enables just-in-time supply models, making Mexico a strategic production location for downstream chemical derivatives, resin conversion, coatings, adhesives, and formulation-based specialty products.
Germany Continues to Dominate the European Inulin Market Industry
German giants are divesting non-core assets and emphasizing specialized applications, technical precision, and high-value customer solutions. For instance, Henkel’s $2.5 billion acquisition of Stahl Holdings in February 2026. Leading Inulin Market companies are formulating strategies to mitigate short-term effects, including supply chain disruptions and destocking, and longer-term structural dynamics. Over the long-term future, demand outlook remains steady across key value chains, driving investments in new product launches and widening distribution channels.
UK- Post-Brexit Divergence and Specialized Clusters
The United Kingdom chemical industry in 2026 is shaped by divergent structural forces combining cost pressure with specialization-driven resilience. European natural gas prices remain structurally around 3.5× higher than U.S. levels, constraining energy-intensive bulk chemical economics and accelerating a pivot toward higher-value specialty chemicals, performance materials, and formulation-led production. Industry restructuring across the region is evident, with chemical plant closures in Europe increasing sixfold since 2022, according to Cefic, reinforcing the UK sector’s move away from commodity exposure toward efficiency-focused, technology-enabled operations. At the same time, logistics capacity is expanding, with the UK chemical logistics market growing at roughly 5% annually to reach about $8 billion in 2026, strengthening the country’s role as a storage, distribution, and re-export hub for specialty and regulated chemical flows.
China and India account for over 40% of global demand
China’s Inulin Market industry is witnessing rapid capacity expansion, technology-led upgrading, and demand reorientation, with accelerated investment across value chain segments reshaping competitive dynamics. The $1.5 trillion chemical industry remains a primary engine of GDP growth, with a government-mandated target of 5% average annual growth in industrial added value through year-end 2026.
Demand fundamentals are also shifting structurally: by 2030, China and India together are projected to account for 40% of global middle-class consumption, up from less than 10% in 2010, indicating long-term expansion in consumption-driven Inulin Market applications. Among end-user markets, Guangdong, Jiangsu, Shandong, Zhejiang, Sichuan, and others are widely focused on by vendors.
India remains a significant outlier with a projected 6.6% GDP growth in 2026, driving a surge in Inulin Market demand. The government's $1.4 trillion National Infrastructure Pipeline is a massive driver for the market outlook. The Indian government is expected to expand the Production Linked Incentive (PLI) scheme for specialty chemicals in 2026.
Japan: Maintaining Dominance in High-Performance Segments
Japan’s Inulin Market industry in 2026 is concentrated in high-performance, specification-critical segments where technical qualification barriers protect margins. Japan’s chemical sector remains one of the world’s most innovation-dense. In 2026, R&D spending in the sector continues to exceed $2.1 Billion annually, with Tokyo and the Kanto region serving as the global hubs for research. Persistent public-sector funding worth ¥4 trillion has moved capital toward advanced materials. To sustain competitive positioning in the evolving environment, Japanese firms can unlock growth by developing new markets through business model transformation and differentiated customer engagement strategies, reflecting the industry’s shift beyond product-led competition toward solution-oriented value creation.
Southeast Asia: The New Manufacturing Core
Southeast Asia is emerging as a primary manufacturing and chemical production growth zone, supported by industrial policy, infrastructure expansion, and supply chain diversification. Vietnam is advancing sector expansion under its Chemical Industry Development Strategy 2030, targeting average annual industry growth of 10–11% through 2030, with emphasis on petrochemicals, downstream plastics, industrial chemicals, and specialty materials serving electronics, construction, and export manufacturing.
The regional economy continues to be resilient, adapting to the shifting landscape and with momentum varying across countries and sectors. Concurrently, Indonesia is accelerating industrial capacity through its National Medium-Term Development Plan (RPJMN), which includes $414 billion in infrastructure investment, strengthening ports, energy systems, and industrial corridors critical for chemical logistics and processing industries.
Middle East- Rapid Economic Growth Supports Potential Business Expansion Opportunities
The Middle East chemical industry is strengthening its position as a global production and export hub through sustained capital deployment, feedstock integration, and downstream diversification. Between 2023 and the end of 2026, the region is tracking around 160 capital projects valued at more than $55 billion, reflecting continued investment in petrochemicals, polymers, specialty derivatives, and industrial chemicals.
The regulatory environment has become increasingly fragmented across geographies. Abundant hydrocarbon feedstocks, integrated refinery-petrochemical complexes, and export-oriented infrastructure provide structural cost advantages that support both commodity and higher-value chemical chains. In Saudi Arabia, the National Industry Strategy targets a fourfold increase in downstream chemical output by 2035, signaling a shift from base petrochemical exports toward specialty materials, performance polymers, and conversion industries.
Competitive Analysis- Intensity of Competition and Market Share
Companies are increasing R&D expenditures by 2-3% while high-intensity segments are witnessing an 8-9% increase in expenditure. The global Inulin Market industry is characterized by intense competition with companies focusing on profit margins through widening end-user applications. Leading companies, including Beneo GmbH (Südzucker Group), Sensus (Royal Cosun), Cosucra Groupe Warcoing SA, Tate & Lyle PLC, Cargill, Incorporated, FrieslandCampina Ingredients, Kerry Group plc, Jilin Fuji Protein Co., Ltd., The Green Labs LLC, Nova-Gum s.r.l., are analyzed in the study. For each company, a detailed business description, SWOT profile, and products and services benchmarking are provided.
Inulin Market Market Segmentation
By Source
Chicory Root
Jerusalem Artichoke
Agave, Garlic, Onion, and Others
By Form
Powder
Liquid / Syrup
By Nature
Conventional
Organic
By Application
Food & Beverages
Dietary Supplements
Pharmaceuticals
Animal Feed
Cosmetics & Personal Care
By Functionality
Sugar & Fat Replacement
Prebiotic/Digestive Health
Texture & Mouthfeel Modification
Top companies in the Inulin Market industry
Beneo GmbH (Südzucker Group)
Sensus (Royal Cosun)
Cosucra Groupe Warcoing SA
Tate & Lyle PLC
Cargill, Incorporated
FrieslandCampina Ingredients
Kerry Group plc
Jilin Fuji Protein Co., Ltd.
The Green Labs LLC
Nova-Gum s.r.l.
Countries Included-
-
North America- US, Canada, Mexico
-
Europe- Germany, France, UK, Spain, Italy, Nordics, Others
-
Asia Pacific- China, India, Japan, South Korea, Australia, Southeast Asia, Others
-
Latin America- Brazil, Argentina, Others
-
Middle East and Africa- Saudi Arabia, UAE, Other Middle East, South Africa, Other Africa
Latest Market Updates In Chemicals
Support this report with fresh, same-industry updates that strengthen topical depth and internal linking.
By Application
Food and Beverage
-Bakery and Confectionery
-Dairy Products
-Meat Products
-Beverage
-Others
Dietary Supplements
Pharmaceuticals