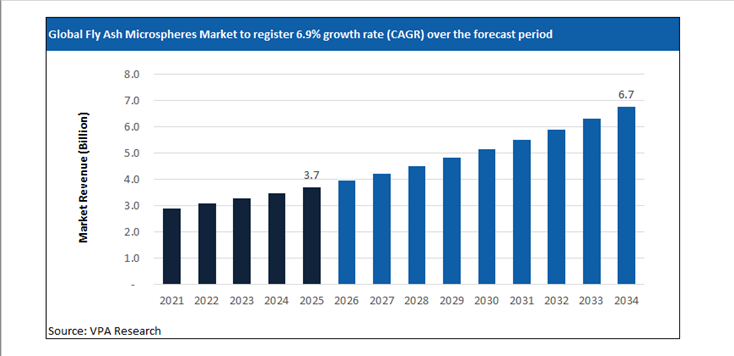
Fly Ash Microspheres Market Snapshot: Market Size, CAGR, and Growth Outlook to 2032
Global Fly Ash Microspheres Market Size is projected to hit $6.7 Billion in 2034 at a CAGR of 6.9% from $3.7 Billion Million in 2025.
The report analyzes the global Fly Ash Microspheres Market across diverse segments including By Type (Hollow Microspheres, Solid Microspheres, Magnetic Microspheres), By Material / Raw Material (Fly Ash, Glass-based, Ceramic-based, Polymer-based), By Size (Micrometers) (0–5 μm, 5–20 μm, 20–50 μm, Above 50 μm), By Application (Lightweight Fillers, Construction Additives, Oil & Gas Fluids, Insulation & Refractories, Paints & Coatings).
The Fly Ash Microspheres Market Market at a Glance (2026)
Thermal Power Byproduct Utilization, Lightweight Fillers, and Materials Engineering Pull
The fly ash microspheres market is structurally linked to coal-fired power generation residue streams and the downstream engineering demand for lightweight, high-strength filler materials. Unlike bulk fly ash, microspheres are recovered through specialized beneficiation and separation processes that isolate hollow aluminosilicate spheres with low density, high compressive strength, and controlled particle morphology. These characteristics underpin their use in construction materials, oilfield cements, automotive composites, and specialty coatings where weight reduction and dimensional stability are performance-critical rather than discretionary attributes.
In 2025, material recovery economics became a central competitive differentiator. Power utilities and ash management contractors increasingly prioritize microsphere extraction as a value recovery pathway rather than disposal mitigation. In India, government-backed ash utilization mandates continued to tighten, reinforcing industrial-scale beneficiation investments. NTPC expanded ash utilization partnerships across multiple thermal stations in 2025, enabling higher recovery of value-added fractions such as microspheres for cementitious and infrastructure applications. These initiatives reflect a shift from compliance-driven ash handling to monetized materials recovery integrated into utility operations.
China remains a structurally dominant source of fly ash microspheres due to its coal generation footprint and mature beneficiation infrastructure. In 2025, provincial authorities in Shanxi and Inner Mongolia reinforced fly ash valorization targets tied to industrial reuse, accelerating investments by regional processors in advanced separation systems. This has supported consistent microsphere availability for domestic construction chemicals and export-oriented polymer compounding markets, particularly in East Asia and the Middle East.
Oilfield Cementing, Automotive Lightweighting, and Application-Locked Demand
The oil and gas sector continues to represent one of the most technically locked-in demand centers for fly ash microspheres, particularly in deepwater and extended-reach well cementing. Microspheres are used to reduce slurry density while maintaining compressive integrity, enabling zonal isolation in challenging geological conditions. In 2025, upstream activity normalization in offshore regions reinforced demand for engineered cement systems incorporating microspheres. Service providers sourcing consistent-quality material increasingly favor suppliers with traceable beneficiation and particle size control capabilities rather than spot-market availability.
Automotive and transportation composites constitute another structurally resilient application. Microspheres are incorporated into thermoplastics and thermoset resins to reduce component weight without compromising mechanical performance. In 2025, multiple Tier 1 automotive suppliers in Europe and Japan expanded lightweight composite programs aligned with emissions compliance and electric vehicle range optimization. These programs increasingly specify microspheres over alternative fillers due to their predictable rheology and low moisture absorption, reinforcing application stickiness.
The construction sector remains volume-driven but increasingly specification-led. High-rise construction, precast elements, and infrastructure repair mortars continue to adopt microspheres for shrinkage control and thermal insulation performance. In Southeast Asia and the Middle East, infrastructure projects incorporating lightweight concrete systems sustained baseline demand through 2025, supported by regional standards recognizing microsphere-enhanced formulations.
Processing Investments, Environmental Controls, and Supplier Differentiation
Supply-side differentiation in the fly ash microspheres market is increasingly defined by processing efficiency, environmental compliance, and consistency rather than scale alone. In 2025, several processors in North America upgraded dry separation and classification systems to reduce variability in wall thickness and particle integrity, responding to tighter quality requirements from polymer and oilfield customers. These investments also reduce waste fractions, improving overall recovery economics.
Environmental scrutiny has intensified around ash handling and beneficiation residues. Producers operating within regulated jurisdictions face higher compliance costs related to water management, dust control, and trace metal monitoring. This has favored operators with integrated environmental control systems and long-term utility contracts. Smaller, opportunistic processors face margin compression due to inconsistent feedstock quality and rising regulatory oversight.
Global Fly Ash Microspheres Market Market Dynamics: Growth Drivers, Restraints, and Opportunities
Strategic Market Drivers: What’s Fueling Growth in 2026?
The Fly Ash Microspheres Market market report provides a comprehensive assessment of the structural and technical factors shaping the market’s evolution in 2026 and beyond. It evaluates demand-side shifts, supply-side constraints, regulatory influences, and technology-led disruption impacting both established players and new market entrants. The Fly Ash Microspheres Market market analysis details the impact of changing end-use requirements, evolving customer specifications, and increasing performance expectations across countries. Further, key drivers and opportunities are mapped across regional and application-level dynamics.
Profit Prioritization and Portfolio Rebalancing
-
Asset Rationalization: Tier 1 players are aggressively divesting low-margin, commoditized assets to reallocate capital toward high-purity, differentiated offerings with superior pricing power.
-
Operating Leverage: Amidst persistent raw material volatility, companies are leveraging Digital Twins and AI-driven manufacturing to optimize OpEx.
-
Specialty Transition: Strategic investments are now concentrated in high-growth niches where customized formulations and technical barriers to entry protect EBITDA margins from global overcapacity in basic chemicals.
A Deep Dive into Emerging Market Hubs
Rapid economic growth, coupled with demand for Fly Ash Microspheres Market are driving the investment focus on these markets. In particular, India, China, Southeast Asia, Brazil, Eastern Europe, and Latin American markets are registering higher than the global average growth rate. The urban population is expected to reach 6 billion by 2045, around 1.3 times the surge from 2023 levels. Rapid industrialization, infrastructure development, urbanization, and expanding domestic consumption are driving above-average demand growth across markets. Leading Fly Ash Microspheres Market companies are accelerating investments in local manufacturing, regional supply chains, and application-specific product development to capture these opportunities.
Emerging Opportunities: Untapped High-Growth Niches in the Post-Pandemic Recovery
The post-pandemic landscape for the chemical industry shifted from crisis management to strategic opportunity. In 2026, leading companies are focused on supply chain regionalization, the hygiene-sustainability nexus, and the digital leap in R&D. The Fly Ash Microspheres Market market is witnessing the emergence of niche, high-growth segments driven by evolving customer needs and regulatory drive. Demand for customized formulations, performance-enhancing solutions, and application-specific variants is rising across advanced manufacturing, specialty end-use industries, and sustainability-led applications. The report identifies underpenetrated segments where innovation, technical differentiation, and faster go-to-market strategies can unlock disproportionate value.
Fly Ash Microspheres Market Market Challenge- Impact of Geopolitical Uncertainty on Market Stability
In 2026, geopolitical risk has become a structural variable shaping the Fly Ash Microspheres Market market rather than a short-term disruption factor. Ongoing trade realignments between the U.S., China, and the EU, coupled with sanctions regimes, export controls, and industrial policy interventions, are directly influencing sourcing strategies, production footprints, and pricing stability across the Fly Ash Microspheres Market value chain. Regional disparities in energy pricing, port congestion risks, and shipping route instability are creating uneven cost structures among global Fly Ash Microspheres Market producers. Accordingly, Fly Ash Microspheres Market companies with regionally diversified production assets and localized supplier ecosystems are demonstrating higher margin stability compared to export-reliant peers.
Fly Ash Microspheres Market Market Strategic Assessment: SWOT, Five Forces, and Value Chain Analysis
Scenario analysis
Amidst varying regulations, trade patterns, supply chain dynamics, and market dynamics, the scenario analysis allows firms to stress-test their current business models. The chapter provides three distinct ‘What-If’ pathways for the Fly Ash Microspheres Market market through 2032- high growth, low growth, and reference cases. The detailed forward-looking assessment ensures that strategic decisions made today remain viable across a range of potential economic and regulatory outcomes.
Value Chain Analysis
The report identifies key players across the Fly Ash Microspheres Market industry value chain, tracing the flow from procurement to end-user. By understanding supplier dependencies, processing intensity, distribution dynamics, and customer power at each stage, stakeholders can identify opportunities for vertical integration, strategic partnerships, localization, or operational optimization.
Porter’s Five Forces Analysis
The Porter’s Five Forces analysis chapter incorporates quantitative scoring and weighted impact evaluation for each competitive force within the Fly Ash Microspheres Market market. This section helps objectively measure industry attractiveness, margin sustainability, and competitive risk using a standardized analytical framework. Companies can evaluate the bargaining power of suppliers and buyers, the threat of substitutes and new entrants, and the degree of rivalry among existing players.
Market Segmentation: Historical and Projected Market Revenue Forecast
Revenue Growth Strategies for Fly Ash Microspheres Market Segments
The report provides the Fly Ash Microspheres Market market size across By Type (Hollow Microspheres, Solid Microspheres, Magnetic Microspheres), By Material / Raw Material (Fly Ash, Glass-based, Ceramic-based, Polymer-based), By Size (Micrometers) (0–5 μm, 5–20 μm, 20–50 μm, Above 50 μm), By Application (Lightweight Fillers, Construction Additives, Oil & Gas Fluids, Insulation & Refractories, Paints & Coatings). Market size outlook across the segments is provided at the global, North America, Europe, Asia Pacific, South and Central America, and the Middle East and African regions. Across each segment, the report analyzes the growth prospects, post-pandemic recovery, and country-specific dynamics.
Regional Outlook for Fly Ash Microspheres Market Manufacturers
United States Fly Ash Microspheres Market Market Size and Share Analysis- Evolving Trade Policies and Supply Chain Reshuffling
The United States Fly Ash Microspheres Market market is being reshaped by evolving trade policies, industrial localization initiatives, and a reconfiguration of global supply chains. The outlook for 2026 is moderately higher relative to 2025, driven by policy-driven sourcing decisions, domestic manufacturing incentives, and strategic supplier realignment.
Global GDP forecasts fell to 3.0% in 2025 and 3.1% in 2026, with US growth slowing to 1.8% and 1.4%, respectively. Tariffs on critical intermediates have added around 0.5 percentage points to core inflation, squeezing the margins of downstream manufacturers. Similarly, an estimated 20% of manufacturers are likely to deploy physical AI to mitigate labor shortages in the US. Over the forecast period, as domestic pricing, margin profiles, and capacity utilization increasingly correlate with U.S.-specific trade exposure, logistics costs, and policy alignment, companies focus significantly on supply-chain optimization.
Canada Fly Ash Microspheres Market Industry Forecast 2026–2032- Increasing role in North America Supply Chain realignment
Canada’s real GDP growth is projected to average 1.25% to 1.5% in 2026, a modest recovery from the 1.3% growth seen in 2025. Unlike the high-volume commodity focus of previous decades, the current market is driven by high-value specialty segments. Strong end-user demand from Ontario, Alberta, Quebec, British Columbia, and other provinces is shaping the long-term growth strategies. The report analyzes the key market drivers and provides the Canada Fly Ash Microspheres Market market size outlook over the forecast period to 2032.
Mexico Fly Ash Microspheres Market - Companies are investing in Nearshoring hubs
Nearshoring into Mexico and Canada is accelerating, with the US-Mexico trade projected to grow by $315 Billion by the end of the decade. The American Chemistry Council (ACC), the National Association of the Chemical Industry of Mexico (ANIQ), and the Chemistry Industry Association of Canada (CIAC) are focusing on renewal and strengthening the USMCA. Geographic proximity to the United States enables just-in-time supply models, making Mexico a strategic production location for downstream chemical derivatives, resin conversion, coatings, adhesives, and formulation-based specialty products.
Germany Continues to Dominate the European Fly Ash Microspheres Market Industry
German giants are divesting non-core assets and emphasizing specialized applications, technical precision, and high-value customer solutions. For instance, Henkel’s $2.5 billion acquisition of Stahl Holdings in February 2026. Leading Fly Ash Microspheres Market companies are formulating strategies to mitigate short-term effects, including supply chain disruptions and destocking, and longer-term structural dynamics. Over the long-term future, demand outlook remains steady across key value chains, driving investments in new product launches and widening distribution channels.
UK- Post-Brexit Divergence and Specialized Clusters
The United Kingdom chemical industry in 2026 is shaped by divergent structural forces combining cost pressure with specialization-driven resilience. European natural gas prices remain structurally around 3.5× higher than U.S. levels, constraining energy-intensive bulk chemical economics and accelerating a pivot toward higher-value specialty chemicals, performance materials, and formulation-led production. Industry restructuring across the region is evident, with chemical plant closures in Europe increasing sixfold since 2022, according to Cefic, reinforcing the UK sector’s move away from commodity exposure toward efficiency-focused, technology-enabled operations. At the same time, logistics capacity is expanding, with the UK chemical logistics market growing at roughly 5% annually to reach about $8 billion in 2026, strengthening the country’s role as a storage, distribution, and re-export hub for specialty and regulated chemical flows.
China and India account for over 40% of global demand
China’s Fly Ash Microspheres Market industry is witnessing rapid capacity expansion, technology-led upgrading, and demand reorientation, with accelerated investment across value chain segments reshaping competitive dynamics. The $1.5 trillion chemical industry remains a primary engine of GDP growth, with a government-mandated target of 5% average annual growth in industrial added value through year-end 2026.
Demand fundamentals are also shifting structurally: by 2030, China and India together are projected to account for 40% of global middle-class consumption, up from less than 10% in 2010, indicating long-term expansion in consumption-driven Fly Ash Microspheres Market applications. Among end-user markets, Guangdong, Jiangsu, Shandong, Zhejiang, Sichuan, and others are widely focused on by vendors.
India remains a significant outlier with a projected 6.6% GDP growth in 2026, driving a surge in Fly Ash Microspheres Market demand. The government's $1.4 trillion National Infrastructure Pipeline is a massive driver for the market outlook. The Indian government is expected to expand the Production Linked Incentive (PLI) scheme for specialty chemicals in 2026.
Japan: Maintaining Dominance in High-Performance Segments
Japan’s Fly Ash Microspheres Market industry in 2026 is concentrated in high-performance, specification-critical segments where technical qualification barriers protect margins. Japan’s chemical sector remains one of the world’s most innovation-dense. In 2026, R&D spending in the sector continues to exceed $2.1 Billion annually, with Tokyo and the Kanto region serving as the global hubs for research. Persistent public-sector funding worth ¥4 trillion has moved capital toward advanced materials. To sustain competitive positioning in the evolving environment, Japanese firms can unlock growth by developing new markets through business model transformation and differentiated customer engagement strategies, reflecting the industry’s shift beyond product-led competition toward solution-oriented value creation.
Southeast Asia: The New Manufacturing Core
Southeast Asia is emerging as a primary manufacturing and chemical production growth zone, supported by industrial policy, infrastructure expansion, and supply chain diversification. Vietnam is advancing sector expansion under its Chemical Industry Development Strategy 2030, targeting average annual industry growth of 10–11% through 2030, with emphasis on petrochemicals, downstream plastics, industrial chemicals, and specialty materials serving electronics, construction, and export manufacturing.
The regional economy continues to be resilient, adapting to the shifting landscape and with momentum varying across countries and sectors. Concurrently, Indonesia is accelerating industrial capacity through its National Medium-Term Development Plan (RPJMN), which includes $414 billion in infrastructure investment, strengthening ports, energy systems, and industrial corridors critical for chemical logistics and processing industries.
Middle East- Rapid Economic Growth Supports Potential Business Expansion Opportunities
The Middle East chemical industry is strengthening its position as a global production and export hub through sustained capital deployment, feedstock integration, and downstream diversification. Between 2023 and the end of 2026, the region is tracking around 160 capital projects valued at more than $55 billion, reflecting continued investment in petrochemicals, polymers, specialty derivatives, and industrial chemicals.
The regulatory environment has become increasingly fragmented across geographies. Abundant hydrocarbon feedstocks, integrated refinery-petrochemical complexes, and export-oriented infrastructure provide structural cost advantages that support both commodity and higher-value chemical chains. In Saudi Arabia, the National Industry Strategy targets a fourfold increase in downstream chemical output by 2035, signaling a shift from base petrochemical exports toward specialty materials, performance polymers, and conversion industries.
Competitive Analysis- Intensity of Competition and Market Share
Companies are increasing R&D expenditures by 2-3% while high-intensity segments are witnessing an 8-9% increase in expenditure. The global Fly Ash Microspheres Market industry is characterized by intense competition with companies focusing on profit margins through widening end-user applications. Leading companies, including Cenosphere India Pvt. Ltd., Boral Limited, Trelleborg AB, Cemex S.A.B. de C.V., LafargeHolcim (Holcim Group), Ashtech India Pvt. Ltd., 3M Company, Reslab, Spherical Materials, Envirospheres, are analyzed in the study. For each company, a detailed business description, SWOT profile, and products and services benchmarking are provided.
Fly Ash Microspheres Market Market Segmentation
By Type
Hollow Microspheres
Solid Microspheres
Magnetic Microspheres
By Material / Raw Material
Fly Ash
Glass-based
Ceramic-based
Polymer-based
By Size (Micrometers)
0–5 μm
5–20 μm
20–50 μm
Above 50 μm
By Application
Lightweight Fillers
Construction Additives
Oil & Gas Fluids
Insulation & Refractories
Paints & Coatings
Top companies in the Fly Ash Microspheres Market industry
Cenosphere India Pvt. Ltd.
Boral Limited
Trelleborg AB
Cemex S.A.B. de C.V.
LafargeHolcim (Holcim Group)
Ashtech India Pvt. Ltd.
3M Company
Reslab
Spherical Materials
Envirospheres
Countries Included-
-
North America- US, Canada, Mexico
-
Europe- Germany, France, UK, Spain, Italy, Nordics, Others
-
Asia Pacific- China, India, Japan, South Korea, Australia, Southeast Asia, Others
-
Latin America- Brazil, Argentina, Others
-
Middle East and Africa- Saudi Arabia, UAE, Other Middle East, South Africa, Other Africa
Latest Market Updates In Chemicals
Support this report with fresh, same-industry updates that strengthen topical depth and internal linking.
By Type
Solid
Hollow
By Raw Material
Fly Ash
Glass
Ceramic
Metallic
Polymer
By End-User
Aerospace
Construction
Oil & Gas
Medical
Automotive
Paints & Coatings
Others