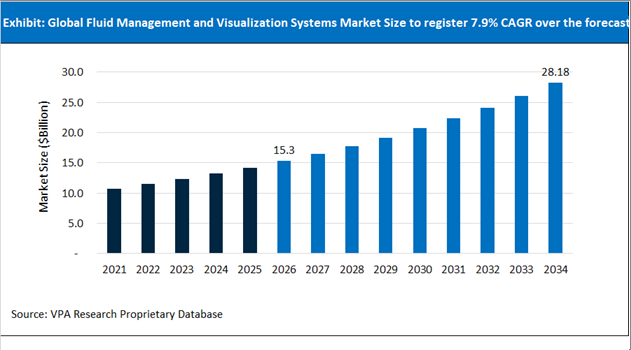
Fluid Management and Visualization Systems Market Snapshot: Market Size, CAGR, and Growth Outlook (2021 to 2034)
The global Fluid Management and Visualization Systems Market size is forecast to increase from $15.3 Billion in 2026 to $28.11 Billion in 2034 at a CAGR of 7.9% between 2026 and 2034.
The Fluid Management and Visualization Systems market report provides detailed analysis and outlook of Fluid Management and Visualization Systems segments including By Product Type (Integrated Fluid Management Systems, Fluid Delivery, Fluid Suction and Collection Systems, Fluid Visualization Systems, Fluid Waste Management Systems, Consumables and Accessories ), By Application (Urology and Nephrology, Gastroenterology, Gynecology, Orthopedic Surgery, Cardiology, Neurology, Otolaryngology ), By Modality (Standalone Systems, Integrated), By End-User (Hospitals, Ambulatory Surgical Centers, Specialty Clinics, Diagnostic Imaging Centers) across global and regional markets. Further, analysis and outlook across 21 countries in North America, Europe, Asia Pacific, Middle East, Africa, and South America are provided in the study.
Fluid Management and Visualization Systems Industry Overview
FDA-Cleared Intelligent Irrigation Systems Enhancing Endoscopic and Urological Precision
The Fluid Management and Visualization Systems Industry is advancing through intelligent automation technologies designed to improve safety and precision in minimally invasive surgical procedures. Boston Scientific Corporation has received FDA 510(k) clearance for its Asurys™ Fluid Management System, engineered for real-time irrigation and distention control during endoscopic urological interventions such as ureteroscopy, cystoscopy, percutaneous nephrolithotomy (PCNL), and benign prostatic hyperplasia (BPH) procedures. The system automatically regulates irrigation inflow based on physician-defined intrarenal pressure thresholds, enhancing intraoperative stability and reducing risks such as renal tissue damage and systemic inflammatory response syndrome (SIRS). This integration of pressure-controlled fluid dynamics represents a significant step toward safer, data-driven surgical environments in urology.
Integrated Surgical Ecosystems Combining Fluid Control and High-Definition Visualization
The Fluid Management and Visualization Systems Industry is increasingly characterized by convergence between fluid control technologies and advanced imaging systems. CONMED Corporation has reported stable growth in its surgical product lines, particularly within sports medicine and minimally invasive orthopedic procedures. The company’s integrated platforms, including Concept® and Shutt® systems, combine powered resection tools with advanced fluid management capabilities to support outpatient surgical workflows. Across the industry, surgical suites are transitioning toward unified systems that synchronize irrigation pumps with high-definition 3D and 4K visualization technologies. These integrated platforms improve procedural accuracy, reduce manual calibration delays, and enhance real-time decision-making during complex arthroscopic and laparoscopic surgeries.
Smart Fluidics and Sensor-Driven Automation in Minimally Invasive Surgery
Technological advancements in sensor-enabled fluidics are reshaping surgical workflow automation in the Fluid Management and Visualization Systems Industry. Next-generation systems are incorporating intra-articular pressure sensors that communicate directly with automated suction and irrigation pumps, enabling continuous regulation of fluid dynamics during orthopedic and endoscopic procedures. This closed-loop approach minimizes human intervention, reduces procedural variability, and improves surgical consistency. The adoption of centralized digital control platforms reflects a broader shift toward fully integrated operating rooms, where fluid management, imaging, and instrumentation are unified into intelligent surgical ecosystems.
Fluid Management and Visualization Systems Market Trends, Growth Drivers, Competitive Landscape, and Future Opportunities
The global Fluid Management and Visualization Systems market is witnessing increasing investments in innovation, product development, digital transformation, artificial intelligence integration, healthcare infrastructure expansion, and strategic partnerships across developed and emerging economies. Key Companies in the industry include- Medtronic plc, Stryker Corporation, Olympus Corporation, Baxter International Inc. (Hill-Rom), KARL STORZ SE & Co. KG, Richard Wolf GmbH, CONMED Corporation, Smith & Nephew plc, Arthrex, Inc., Ecolab Inc.. The Fluid Management and Visualization Systems market is expected to remain one of the most closely watched segments in the global healthcare industry, with companies focusing on niche market segments. As healthcare systems across the US, Europe, Asia-Pacific, Latin America, and Middle East & Africa continue to prioritize efficiency, access, and innovation, the Fluid Management and Visualization Systems industry outlook remains shaped by rising healthcare expenditure, demographic change, digital transformation, and product innovation.
The report provides detailed market analysis including-
-
Growth Fluid Management and Visualization Systems Market size outlook across 3 scenarios- High growth, reference, and Low growth cases
-
Market Trends, Drivers, Potential Opportunities, and Challenges faced by Fluid Management and Visualization Systems companies
-
Porter’s Five forces analysis- Bargaining power of buyers and sellers, Threat of Substitutes and new entrants, and Intensity of competitive rivalry
-
Detailed SWOT Analysis of global and regional Fluid Management and Visualization Systems markets
-
Competitive analysis including business description, product analysis, and financial profiles
-
Key country specific analysis detailing key factors shaping the short-term and long-term outlook
-
Recent industry developments and news including mergers, acquisitions, product launches, expansions, and company announcements
Fluid Management and Visualization Systems Market Competitive Benchmarking and Company Analysis
Leading companies in Fluid Management and Visualization Systems industry include- Medtronic plc, Stryker Corporation, Olympus Corporation, Baxter International Inc. (Hill-Rom), KARL STORZ SE & Co. KG, Richard Wolf GmbH, CONMED Corporation, Smith & Nephew plc, Arthrex, Inc., Ecolab Inc.. The Fluid Management and Visualization Systems market remains moderately to highly fragmented, with competition expected to intensify as companies accelerate investments in innovation, geographic expansion, strategic partnerships, and portfolio diversification through 2034. In developed markets such as the United States, Germany, France, the United Kingdom, and Canada, competition is increasingly centered on innovation, reimbursement positioning, and value-based healthcare solutions. Meanwhile, emerging markets including China, India, Brazil, and countries across the Middle East and Africa continue to present significant opportunities for expansion due to rising healthcare expenditure, growing patient populations, and increasing access to healthcare services.
What to expect in US Fluid Management and Visualization Systems Markets in 2026 and beyond- Market Size, Share, Growth Rate, and Forecast to 2034
The US healthcare expenditure is forecast to reach $8.2 Trillion in 2034 from $5.5 Trillion in 2026 based on the National Health Expenditure Accounts (NHEA) data. With an aging population, rising chronic disease burden, and increasing migration toward minimally invasive and outpatient care, the Fluid Management and Visualization Systems market remains one of the strongest-performing segments in the country.
The US Fluid Management and Visualization Systems Companies are opting new business models, optimized pricing models, industry partnerships, and AI-enabled back end transformations to enhance efficiency and cost management. The US Fluid Management and Visualization Systems market faces successive waves of challenging trends, with strong opportunities across select segments. The CMS plan to implement Medicaid from 2027 is driving states to build eligibility verification systems throughout 2026. Looking ahead to 2034, we anticipate stronger results underpinned by opportunities exist across Fluid Management and Visualization Systems industry. On the medical device front, over 7,000 device manufacturers continue to gain from increasing demand from demand for implantable devices, surgical instruments, monitoring equipment, and diagnostic systems.
Canada- Proximity to the US and healthcare similarities to EU5 countries fuel sales of Canadian Fluid Management and Visualization Systems markets
Canada's strong Fluid Management and Visualization Systems sales performance is underpinned by an aging population and a well-developed healthcare infrastructure. Steady growth in new brand spending in rural and urban locations fuel the long-term prospects of small and medium-sized enterprises across medical, diagnostic, and therapeutic devices. The Canadian Fluid Management and Visualization Systems market presents significant opportunities for U.S. exporters of medical devices, with the U.S. being Canada’s largest trading partner for this sector. Potential advantages including specialized materials, advanced manufacturing techniques, and digital technologies support the launch of new products in the country.
Germany Fluid Management and Visualization Systems Trends and Perspectives to 2034- Financial sustainability, hospital restructuring, demographic pressures, and digitization of care delivery continue to shape the German healthcare industry.
Germany continues to remain the largest Fluid Management and Visualization Systems market in Europe, driven by over €600 Billion healthcare expenditure, €12 Billion medical device R&D expenditure, statutory health insurance system covering 90% German population, nationwide rollout of the electronic patient record (ePA), and large-volume of Fluid Management and Visualization Systems population. In particular, Research and development in Germany fuels the commercialization of cutting-edge technologies. Companies across the Germany Fluid Management and Visualization Systems industry value chain are focusing on both domestic markets and exports. The country is also driving digital adoption with the Hospital Future Act driving hospitals to upgrade their information systems by 2027. Over the forecast period, aging population, rising healthcare costs, and increasing procedural volumes drive the Fluid Management and Visualization Systems market outlook.
France Market Size, Growth Rate, and Forecast Analysis to 2034- Universal healthcare system, high public healthcare expenditure, and strong government support Fluid Management and Visualization Systems sales through 2034
France Fluid Management and Visualization Systems companies are emphasizing on opportunities for rapid, at-scale innovation to boost profitability over the long-term. The country’s National Health Insurance spending target (ONDAM) estimates 3.7% growth in the country’s healthcare expenditure. Over the forecast period, expenditure control measures, chronic disease management initiatives, workforce reforms, and efforts to improve system efficiency drive the long-term prospects.
The biggest 2026 policy frame is the PLFSS 2026. The law sets the Maladie branch spending target at €271.4 billion for 2026 and fixes the ONDAM at €117.5 billion for city care, €112.8 billion for health establishments, and €18.3 billion for elderly-care establishments and services. France’s market is also being pulled by demographics. INSEE estimates that on 1 January 2026 France had 69.1 million inhabitants, with 22% aged 65 or over. INSEE also reported that 2025 births were 645,000 and deaths were 651,000, producing a negative natural balance of about 6,000 for the first time since the end of the Second World War.
UK Fluid Management and Visualization Systems Market Size, Share, and Growth Projections to 2034- Rapid growth driven by new and existing brands across the industry value chain
Small high-need consumer segments remain key priority of Fluid Management and Visualization Systems distributors in the UK industry. Continuous launch of new products coupled with high expenditures support the market outlook. The UK Government financing remains the dominant funding source at 81.3% of total healthcare expenditure, or £280 billion in 2025. According to the ONS, total healthcare spending grew 7.7% nominally and 3.9% in real terms from 2024 to 2025. Similarly, out-of-pocket spending was £49 billion (14.1%) and voluntary health insurance was £9.5 billion (2.8%). The market is driven by rapid digital adoption with NHS England’s plan to give more than 500,000 staff access to new AI tools.
China Fluid Management and Visualization Systems Market Growth Drivers, Revenue Trends, and Forecast- Medical insurance coverage is rapidly expanding over the past few years
China Fluid Management and Visualization Systems market is undergoing a structural shift from hospital-centric care toward a more integrated system emphasizing primary care, outpatient services, and long-term care. Chinese local players are emerging as a strong pillar of Fluid Management and Visualization Systems industry, offering opportunities for both competition and partnership. Over the forecast period, new and innovative product launches remain key elements driving market outlook. China's healthcare industry is increasingly centered on expanding healthcare capacity, improving access to advanced treatments, and reducing dependence on imported technologies.
The National Healthcare Security Administration reported that by end-2024, China’s basic medical insurance covered 1.32662 billion people and the coverage rate was 95%. Regional disparities in consumer spending trends continue to become more pronounced in the Chinese Fluid Management and Visualization Systems industry. Over the forecast period, demand will keep shifting toward geriatrics, chronic disease management, rehabilitation, long-term care, and outpatient care, while pricing pressure will remain intense in drugs and consumables because reimbursement.
India Fluid Management and Visualization Systems Market Landscape: Current Size and Long-Term Growth Outlook - Increased pricing pressures in US market is encouraging domestic vendors to expand across India
Indian Fluid Management and Visualization Systems market is witnessing the rapid emergence of an ecosystem that brings together diverse companies across the industry value chain. Further, large-scale healthcare public and private investments and a steady growth in chronic conditions is driving sales of pharmaceuticals and medical devices. Further, non-retail channel is experiencing volume decrease and patients are migrating to the retail. Indian medical device firms are also combining precision engineering with lower labor costs to make world-class diagnostics, robotics, and critical care devices.
Brazil Fluid Management and Visualization Systems market remains price-driven, with products domestically manufactured and accessibility offering potential opportunities
Healthcare expenditure in Brazil exceeds 10% of GDP, with the country among the highest healthcare spenders in Latin America. ANS reported 53.2 million medical-plan beneficiaries in December 2025, while IBGE projects a steady rise in older-age cohorts, with people aged 60+ already representing about 23% of the population. The price sensitive market access is broad through the public system, private coverage adds a sizeable premium layer, and reimbursement, procurement, and hospital efficiency remain key buying drivers.
Middle East and Africa Fluid Management and Visualization Systems Industry Trends and Perspectives to 2034
According to the World Bank, the Middle East and North Africa population exceeds 500 million, while Sub-Saharan Africa's population exceeds 1.2 billion, making the broader MEA region one of the fastest-growing healthcare demand centers globally. The GCC countries including Saudi Arabia, United Arab Emirates, Qatar, and Kuwait continue to account for a disproportionately large share of regional healthcare spending. Government-led programs such as Saudi Arabia's Vision 2030 are accelerating investments in hospital infrastructure, private-sector participation, medical technology adoption, and healthcare digitalization. On the other hand, South Africa, Egypt, Nigeria, and Kenya remain key healthcare markets due to their large populations, expanding private healthcare sectors, and growing investments in healthcare delivery systems.
Fluid Management and Visualization Systems Market Segmentation
By Product Type
Integrated Fluid Management Systems
Fluid Delivery
Fluid Suction and Collection Systems
Fluid Visualization Systems
Fluid Waste Management Systems
Consumables and Accessories
By Application
Urology and Nephrology
Gastroenterology
Gynecology
Orthopedic Surgery
Cardiology
Neurology
Otolaryngology
By Modality
Standalone Systems
Integrated
By End-User
Hospitals
Ambulatory Surgical Centers
Specialty Clinics
Diagnostic Imaging Centers
Top Companies in Fluid Management and Visualization Systems Industry
Medtronic plc
Stryker Corporation
Olympus Corporation
Baxter International Inc. (Hill-Rom)
KARL STORZ SE & Co. KG
Richard Wolf GmbH
CONMED Corporation
Smith & Nephew plc
Arthrex, Inc.
Ecolab Inc.
Countries Included
-
North America- US, Canada, Mexico
-
Europe- Germany, France, UK, Spain, Italy, Nordics, Others
-
Asia Pacific- China, India, Japan, South Korea, Australia, Southeast Asia, Others
-
Latin America- Brazil, Argentina, Others
-
Middle East and Africa- Saudi Arabia, UAE, Other Middle East, South Africa, Other Africa
Latest Market Updates In Healthcare
Support this report with fresh, same-industry updates that strengthen topical depth and internal linking.
Low MOQ, High-Mix Production Models for Indie & DTC Brands
The rising geopolitical and tariff-related uncertainties, in particular, amidst United States’ renewed protectionist trade stance continues to driv...
Market UpdateRise of Functional and Clinical-Grade Skincare
The rising geopolitical and tariff-related uncertainties, in particular, amidst United States’ renewed protectionist trade stance continues to driv...
By Product Type
Integrated Fluid Management Systems
Fluid Delivery
Fluid Suction and Collection Systems
Fluid Visualization Systems
Fluid Waste Management Systems
Consumables and Accessories
By Application
Urology and Nephrology
Gastroenterology
Gynecology
Orthopedic Surgery
Cardiology
Neurology
Otolaryngology
By Modality
Standalone Systems
Integrated
By End-User
Hospitals
Ambulatory Surgical Centers
Specialty Clinics
Diagnostic Imaging Centers