Fishery By-products Market Market Snapshot: Market Size, CAGR, and Growth Outlook to 2032
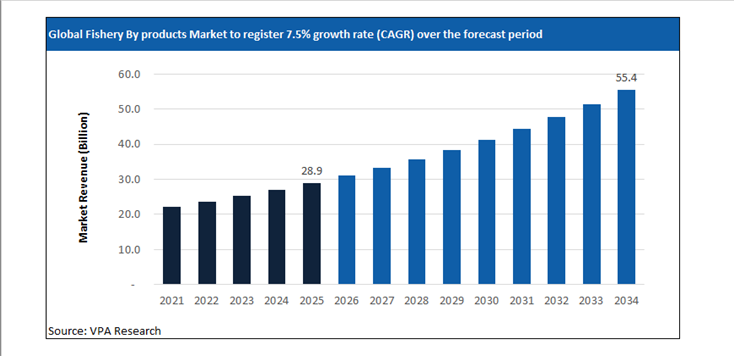
Global Fishery By-products Market Size is projected to hit $55.4 Billion in 2034 at a CAGR of 7.5% from $28.9 Billion in 2025.
The report analyzes the global Fishery By-products Market Market across diverse segments including By Product Type (Fishmeal, Fish Oil, Fish Silage, Fish Protein Hydrolysates, Solubles & Concentrates, Others, By Source (Marine Capture Fisheries, Aquaculture Processing Waste, Whole Food-Grade Fish, By End-Use Industry (Food & Beverage, Healthcare & Life Sciences, Agrochemicals, Animal Nutrition).
The Fishery By-products Market Market at a Glance (2026)
Transition from Waste Streams to High-Value Marine Bio-Ingredients
The fishery by-products market in 2026 is being reshaped by the systematic conversion of previously discarded biomass into commercially viable, high-margin ingredients. Processing residues such as fish skins, scales, bones, and viscera are now recognized as critical raw materials for nutraceuticals, pharmaceuticals, and specialty feed applications. This transition is closely linked to the growing demand for marine-derived collagen, gelatin, and bioactive peptides, particularly within sports nutrition and functional food formulations.
Recent industry disclosures highlight how leading processors are scaling extraction capabilities to capture value from underutilized biomass streams. Marine collagen derived from fish skins is gaining traction due to its high bioavailability and compatibility with clean-label product positioning. Similarly, peptones extracted from fish proteins are increasingly used in microbial fermentation processes, supporting biotechnology and vaccine production. These developments are transforming the economics of seafood processing by shifting revenue generation beyond primary fillet production toward integrated bio-refining models.
The supply chain is also evolving to support traceability and quality assurance requirements, especially for applications in human consumption. Processors are investing in cold chain logistics and rapid stabilization techniques to preserve the biochemical integrity of raw by-products. This ensures that extracted compounds meet stringent purity and safety standards required by global regulatory frameworks, positioning fishery by-products as a reliable input for high-value downstream industries.
Enzymatic Hydrolysis and Green Processing Technologies Driving Yield Optimization
Technological advancement in extraction methodologies is a defining factor in the fishery by-products market in 2026. Enzymatic hydrolysis has emerged as the dominant processing technique, replacing traditional chemical methods that often compromise nutritional quality and generate environmental concerns. This approach utilizes targeted enzymes to break down complex proteins into bioactive peptides while preserving essential amino acids and functional properties.
The adoption of enzymatic hydrolysis is particularly pronounced in the production of fish protein hydrolysates, which are widely used in infant nutrition, clinical diets, and premium pet food formulations. These hydrolysates offer enhanced digestibility, improved taste profiles, and reduced allergenicity compared to conventional protein sources. As a result, manufacturers are prioritizing enzyme-based systems to meet the growing demand for functional and hypoallergenic protein ingredients.
Process scalability is another critical development area. Industrial facilities are integrating continuous hydrolysis systems with real-time monitoring to optimize reaction conditions and maximize yield efficiency. This reduces processing time and energy consumption while improving consistency across production batches. In addition, advancements in membrane filtration and drying technologies are enabling the recovery of high-purity fractions tailored to specific applications, further expanding the commercial potential of fish-derived biomolecules.
Circular Economy Mandates and Aquaculture Integration Expanding Revenue Streams
Regulatory and sustainability frameworks are playing a central role in shaping the fishery by-products market landscape in 2026. New marine bio-resource guidelines, particularly within European markets, are mandating zero-waste practices across aquaculture and seafood processing operations. This is accelerating the commercialization of secondary product streams and encouraging companies to adopt circular economy principles as a core business strategy.
One of the most notable developments is the extraction of chitosan from shellfish waste, which is being deployed in biodegradable packaging, water treatment, and agricultural applications. This biopolymer offers antimicrobial properties and environmental compatibility, making it a preferred alternative to synthetic materials in sustainability-driven markets. Similarly, fish oils recovered from processing waste are being refined for use in omega-3 supplements and functional foods, aligning with global health and wellness trends.
Aquaculture operators are increasingly integrating by-product valorization into their operational models, reducing waste disposal costs while generating additional revenue streams. This integration is supported by partnerships between seafood processors, biotechnology firms, and material science companies, enabling cross-sector innovation. As sustainability reporting becomes more stringent, the ability to demonstrate full resource utilization is emerging as a competitive differentiator, reinforcing the strategic importance of fishery by-products in the broader blue economy.
Global Fishery By-products Market Market Dynamics: Growth Drivers, Restraints, and Opportunities
Strategic Market Drivers: What’s Fueling Growth in 2026?
The Fishery By-products Market market report provides a comprehensive assessment of the structural and technical factors shaping the market’s evolution in 2026 and beyond. It evaluates demand-side shifts, supply-side constraints, regulatory influences, and technology-led disruption impacting both established players and new market entrants. The Fishery By-products Market market analysis details the impact of changing end-use requirements, evolving customer specifications, and increasing performance expectations across countries. Further, key drivers and opportunities are mapped across regional and application-level dynamics.
Profit Prioritization and Portfolio Rebalancing
-
Asset Rationalization: Tier 1 players are aggressively divesting low-margin, commoditized assets to reallocate capital toward high-purity, differentiated offerings with superior pricing power.
-
Operating Leverage: Amidst persistent raw material volatility, companies are leveraging Digital Twins and AI-driven manufacturing to optimize OpEx.
-
Specialty Transition: Strategic investments are now concentrated in high-growth niches where customized formulations and technical barriers to entry protect EBITDA margins from global overcapacity in basic chemicals.
A Deep Dive into Emerging Market Hubs
Rapid economic growth, coupled with demand for Fishery By-products Market are driving the investment focus on these markets. In particular, India, China, Southeast Asia, Brazil, Eastern Europe, and Latin American markets are registering higher than the global average growth rate. The urban population is expected to reach 6 billion by 2045, around 1.3 times the surge from 2023 levels. Rapid industrialization, infrastructure development, urbanization, and expanding domestic consumption are driving above-average demand growth across markets. Leading Fishery By-products Market companies are accelerating investments in local manufacturing, regional supply chains, and application-specific product development to capture these opportunities.
Emerging Opportunities: Untapped High-Growth Niches in the Post-Pandemic Recovery
The post-pandemic landscape for the chemical industry shifted from crisis management to strategic opportunity. In 2026, leading companies are focused on supply chain regionalization, the hygiene-sustainability nexus, and the digital leap in R&D. The Fishery By-products Market market is witnessing the emergence of niche, high-growth segments driven by evolving customer needs and regulatory drive. Demand for customized formulations, performance-enhancing solutions, and application-specific variants is rising across advanced manufacturing, specialty end-use industries, and sustainability-led applications. The report identifies underpenetrated segments where innovation, technical differentiation, and faster go-to-market strategies can unlock disproportionate value.
Fishery By-products Market Market Challenge- Impact of Geopolitical Uncertainty on Market Stability
In 2026, geopolitical risk has become a structural variable shaping the Fishery By-products Market market rather than a short-term disruption factor. Ongoing trade realignments between the U.S., China, and the EU, coupled with sanctions regimes, export controls, and industrial policy interventions, are directly influencing sourcing strategies, production footprints, and pricing stability across the Fishery By-products Market value chain. Regional disparities in energy pricing, port congestion risks, and shipping route instability are creating uneven cost structures among global Fishery By-products Market producers. Accordingly, Fishery By-products Market companies with regionally diversified production assets and localized supplier ecosystems are demonstrating higher margin stability compared to export-reliant peers.
Fishery By-products Market Market Strategic Assessment: SWOT, Five Forces, and Value Chain Analysis
Scenario analysis
Amidst varying regulations, trade patterns, supply chain dynamics, and market dynamics, the scenario analysis allows firms to stress-test their current business models. The chapter provides three distinct ‘What-If’ pathways for the Fishery By-products Market market through 2032- high growth, low growth, and reference cases. The detailed forward-looking assessment ensures that strategic decisions made today remain viable across a range of potential economic and regulatory outcomes.
Value Chain Analysis
The report identifies key players across the Fishery By-products Market industry value chain, tracing the flow from procurement to end-user. By understanding supplier dependencies, processing intensity, distribution dynamics, and customer power at each stage, stakeholders can identify opportunities for vertical integration, strategic partnerships, localization, or operational optimization.
Porter’s Five Forces Analysis
The Porter’s Five Forces analysis chapter incorporates quantitative scoring and weighted impact evaluation for each competitive force within the Fishery By-products Market market. This section helps objectively measure industry attractiveness, margin sustainability, and competitive risk using a standardized analytical framework. Companies can evaluate the bargaining power of suppliers and buyers, the threat of substitutes and new entrants, and the degree of rivalry among existing players.
Market Segmentation: Historical and Projected Market Revenue Forecast
Revenue Growth Strategies for Fishery By-products Market Segments
The report provides the Fishery By-products Market market size across By Product Type (Fishmeal, Fish Oil, Fish Silage, Fish Protein Hydrolysates, Solubles & Concentrates, Others, By Source (Marine Capture Fisheries, Aquaculture Processing Waste, Whole Food-Grade Fish, By End-Use Industry (Food & Beverage, Healthcare & Life Sciences, Agrochemicals, Animal Nutrition). Market size outlook across the segments is provided at the global, North America, Europe, Asia Pacific, South and Central America, and the Middle East and African regions. Across each segment, the report analyzes the growth prospects, post-pandemic recovery, and country-specific dynamics.
Regional Outlook for Fishery By-products Market Manufacturers
United States Fishery By-products Market Market Size and Share Analysis- Evolving Trade Policies and Supply Chain Reshuffling
The United States Fishery By-products Market market is being reshaped by evolving trade policies, industrial localization initiatives, and a reconfiguration of global supply chains. The outlook for 2026 is moderately higher relative to 2025, driven by policy-driven sourcing decisions, domestic manufacturing incentives, and strategic supplier realignment.
Global GDP forecasts fell to 3.0% in 2025 and 3.1% in 2026, with US growth slowing to 1.8% and 1.4%, respectively. Tariffs on critical intermediates have added around 0.5 percentage points to core inflation, squeezing the margins of downstream manufacturers. Similarly, an estimated 20% of manufacturers are likely to deploy physical AI to mitigate labor shortages in the US. Over the forecast period, as domestic pricing, margin profiles, and capacity utilization increasingly correlate with U.S.-specific trade exposure, logistics costs, and policy alignment, companies focus significantly on supply-chain optimization.
Canada Fishery By-products Market Industry Forecast 2026–2032- Increasing role in North America Supply Chain realignment
Canada’s real GDP growth is projected to average 1.25% to 1.5% in 2026, a modest recovery from the 1.3% growth seen in 2025. Unlike the high-volume commodity focus of previous decades, the current market is driven by high-value specialty segments. Strong end-user demand from Ontario, Alberta, Quebec, British Columbia, and other provinces is shaping the long-term growth strategies. The report analyzes the key market drivers and provides the Canada Fishery By-products Market market size outlook over the forecast period to 2032.
Mexico Fishery By-products Market - Companies are investing in Nearshoring hubs
Nearshoring into Mexico and Canada is accelerating, with the US-Mexico trade projected to grow by $315 Billion by the end of the decade. The American Chemistry Council (ACC), the National Association of the Chemical Industry of Mexico (ANIQ), and the Chemistry Industry Association of Canada (CIAC) are focusing on renewal and strengthening the USMCA. Geographic proximity to the United States enables just-in-time supply models, making Mexico a strategic production location for downstream chemical derivatives, resin conversion, coatings, adhesives, and formulation-based specialty products.
Germany Continues to Dominate the European Fishery By-products Market Industry
German giants are divesting non-core assets and emphasizing specialized applications, technical precision, and high-value customer solutions. For instance, Henkel’s $2.5 billion acquisition of Stahl Holdings in February 2026. Leading Fishery By-products Market companies are formulating strategies to mitigate short-term effects, including supply chain disruptions and destocking, and longer-term structural dynamics. Over the long-term future, demand outlook remains steady across key value chains, driving investments in new product launches and widening distribution channels.
UK- Post-Brexit Divergence and Specialized Clusters
The United Kingdom chemical industry in 2026 is shaped by divergent structural forces combining cost pressure with specialization-driven resilience. European natural gas prices remain structurally around 3.5× higher than U.S. levels, constraining energy-intensive bulk chemical economics and accelerating a pivot toward higher-value specialty chemicals, performance materials, and formulation-led production. Industry restructuring across the region is evident, with chemical plant closures in Europe increasing sixfold since 2022, according to Cefic, reinforcing the UK sector’s move away from commodity exposure toward efficiency-focused, technology-enabled operations. At the same time, logistics capacity is expanding, with the UK chemical logistics market growing at roughly 5% annually to reach about $8 billion in 2026, strengthening the country’s role as a storage, distribution, and re-export hub for specialty and regulated chemical flows.
China and India account for over 40% of global demand
China’s Fishery By-products Market industry is witnessing rapid capacity expansion, technology-led upgrading, and demand reorientation, with accelerated investment across value chain segments reshaping competitive dynamics. The $1.5 trillion chemical industry remains a primary engine of GDP growth, with a government-mandated target of 5% average annual growth in industrial added value through year-end 2026.
Demand fundamentals are also shifting structurally: by 2030, China and India together are projected to account for 40% of global middle-class consumption, up from less than 10% in 2010, indicating long-term expansion in consumption-driven Fishery By-products Market applications. Among end-user markets, Guangdong, Jiangsu, Shandong, Zhejiang, Sichuan, and others are widely focused on by vendors.
India remains a significant outlier with a projected 6.6% GDP growth in 2026, driving a surge in Fishery By-products Market demand. The government's $1.4 trillion National Infrastructure Pipeline is a massive driver for the market outlook. The Indian government is expected to expand the Production Linked Incentive (PLI) scheme for specialty chemicals in 2026.
Japan: Maintaining Dominance in High-Performance Segments
Japan’s Fishery By-products Market industry in 2026 is concentrated in high-performance, specification-critical segments where technical qualification barriers protect margins. Japan’s chemical sector remains one of the world’s most innovation-dense. In 2026, R&D spending in the sector continues to exceed $2.1 Billion annually, with Tokyo and the Kanto region serving as the global hubs for research. Persistent public-sector funding worth ¥4 trillion has moved capital toward advanced materials. To sustain competitive positioning in the evolving environment, Japanese firms can unlock growth by developing new markets through business model transformation and differentiated customer engagement strategies, reflecting the industry’s shift beyond product-led competition toward solution-oriented value creation.
Southeast Asia: The New Manufacturing Core
Southeast Asia is emerging as a primary manufacturing and chemical production growth zone, supported by industrial policy, infrastructure expansion, and supply chain diversification. Vietnam is advancing sector expansion under its Chemical Industry Development Strategy 2030, targeting average annual industry growth of 10–11% through 2030, with emphasis on petrochemicals, downstream plastics, industrial chemicals, and specialty materials serving electronics, construction, and export manufacturing.
The regional economy continues to be resilient, adapting to the shifting landscape and with momentum varying across countries and sectors. Concurrently, Indonesia is accelerating industrial capacity through its National Medium-Term Development Plan (RPJMN), which includes $414 billion in infrastructure investment, strengthening ports, energy systems, and industrial corridors critical for chemical logistics and processing industries.
Middle East- Rapid Economic Growth Supports Potential Business Expansion Opportunities
The Middle East chemical industry is strengthening its position as a global production and export hub through sustained capital deployment, feedstock integration, and downstream diversification. Between 2023 and the end of 2026, the region is tracking around 160 capital projects valued at more than $55 billion, reflecting continued investment in petrochemicals, polymers, specialty derivatives, and industrial chemicals.
The regulatory environment has become increasingly fragmented across geographies. Abundant hydrocarbon feedstocks, integrated refinery-petrochemical complexes, and export-oriented infrastructure provide structural cost advantages that support both commodity and higher-value chemical chains. In Saudi Arabia, the National Industry Strategy targets a fourfold increase in downstream chemical output by 2035, signaling a shift from base petrochemical exports toward specialty materials, performance polymers, and conversion industries.
Competitive Analysis- Intensity of Competition and Market Share
Companies are increasing R&D expenditures by 2-3% while high-intensity segments are witnessing an 8-9% increase in expenditure. The global Fishery By-products Market industry is characterized by intense competition with companies focusing on profit margins through widening end-user applications. Leading companies, including Mowi ASA, Lerøy Seafood Group ASA, Thai Union Group PCL, Pelagia AS, TripleNine Group A/S, Omega Protein Corporation (Cooke Inc.), Cargill, Incorporated, BioMar Group, TASA (Tecnológica de Alimentos S.A.), FF Skagen A/S, are analyzed in the study. For each company, a detailed business description, SWOT profile, and products and services benchmarking are provided.
Fishery By-products Market Market Segmentation
By Product Type
Fishmeal
Fish Oil
Fish Silage
Fish Protein Hydrolysates
Solubles & Concentrates
Others
By Source
Marine Capture Fisheries
Aquaculture Processing Waste
Whole Food-Grade Fish
By End-Use Industry
Food & Beverage
Healthcare & Life Sciences
Agrochemicals
Animal Nutrition
Top companies in the Fishery By-products Market industry
Mowi ASA
Lerøy Seafood Group ASA
Thai Union Group PCL
Pelagia AS
TripleNine Group A/S
Omega Protein Corporation (Cooke Inc.)
Cargill, Incorporated
BioMar Group
TASA (Tecnológica de Alimentos S.A.)
FF Skagen A/S
Countries Included-
-
North America- US, Canada, Mexico
-
Europe- Germany, France, UK, Spain, Italy, Nordics, Others
-
Asia Pacific- China, India, Japan, South Korea, Australia, Southeast Asia, Others
-
Latin America- Brazil, Argentina, Others
-
Middle East and Africa- Saudi Arabia, UAE, Other Middle East, South Africa, Other Africa
Latest Market Updates In Chemicals
Support this report with fresh, same-industry updates that strengthen topical depth and internal linking.
Low MOQ, High-Mix Production Models for Indie & DTC Brands
The rising geopolitical and tariff-related uncertainties, in particular, amidst United States’ renewed protectionist trade stance continues to driv...
Market UpdateRise of Functional and Clinical-Grade Skincare
The rising geopolitical and tariff-related uncertainties, in particular, amidst United States’ renewed protectionist trade stance continues to driv...
By Product Type
Fishmeal
Fish Oil
Fish Silage
Fish Protein Hydrolysates
Solubles & Concentrates
Others
By Source
Marine Capture Fisheries
Aquaculture Processing Waste
Whole Food-Grade Fish
By End-Use Industry
Food & Beverage
Healthcare & Life Sciences
Agrochemicals
Animal Nutrition