Computed Tomography Market Snapshot: Market Size, CAGR, and Growth Outlook (2021 to 2034)
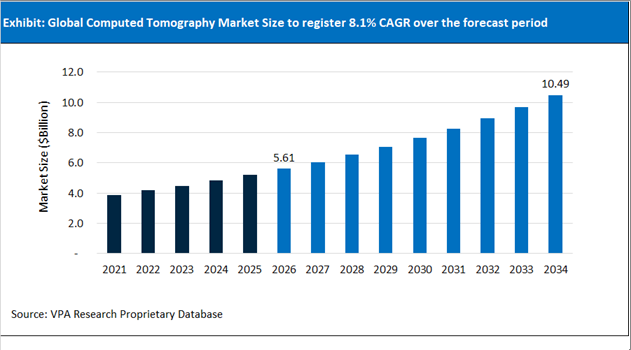
The global Computed Tomography Market size is forecast to increase from $5.61 Billion in 2026 to $10.46 Billion in 2034 at a CAGR of 8.1% between 2026 and 2034.
The Computed Tomography market report provides detailed analysis and outlook of Computed Tomography segments including By Component (Hardware Systems, Software & AI Integration Platforms, Services ), By Slice Count (Low-Slice CT Scanners, Mid-Slice CT Scanners, High-Slice CT Scanners, Cone Beam CT ), By Technology Type (Dual-Energy, Photon-Counting CT, Iterative Reconstruction CT), By Modality (Stationary CT Systems, Portable, Hybrid Configurations ), By Application (Oncology, Cardiology, Neurology, Musculoskeletal & Trauma, Vascular and Guided Interventions), By End-User (Hospitals and Multi-Specialty Medical Centers, Diagnostic Imaging Centers, Ambulatory Surgical Centers) across global and regional markets. Further, analysis and outlook across 21 countries in North America, Europe, Asia Pacific, Middle East, Africa, and South America are provided in the study.
Computed Tomography (CT) Industry Overview
Photon-Counting CT Technology Transforming Diagnostic Imaging Capabilities
The computed tomography industry is experiencing substantial technological advancement through the rapid adoption of photon-counting CT systems. Leading imaging companies including Siemens Healthineers and GE HealthCare are driving expansion of photon-counting CT installations across global healthcare markets. GE HealthCare recently announced expanded clinical clearance for its Revolution™ CT systems equipped with photon-counting detectors in multiple regions, further accelerating adoption of this next-generation imaging technology. Photon-counting CT delivers significantly higher spatial resolution, enhanced tissue characterization, improved spectral imaging capabilities, and reduced image noise compared with conventional detector technologies. Additionally, the technology enables diagnostic imaging with substantially lower contrast agent requirements, offering important benefits for patients with renal impairment and other clinical considerations. These advancements are positioning photon-counting CT as one of the most important innovations in modern medical imaging.
Artificial Intelligence Integration Enhancing CT Workflow Efficiency
Artificial intelligence is becoming increasingly embedded within computed tomography workflows as healthcare providers seek to improve imaging quality, operational efficiency, and patient throughput. The industry is rapidly moving toward AI-in-the-loop scanning environments where intelligent software actively supports imaging procedures. Recent software enhancements from Canon Medical Systems Corporation incorporate AI-driven tools that assist radiology professionals with patient positioning and scan parameter optimization. These technologies help minimize errors associated with patient movement and suboptimal image acquisition settings, reducing the frequency of repeat examinations. By decreasing the need for re-scans and improving first-time image quality, AI-assisted CT systems contribute to greater scanner utilization and workflow productivity. The integration of machine learning algorithms into routine imaging operations reflects a broader trend toward automation and intelligent decision support within diagnostic radiology.
Radiation Dose Reduction Policies Driving Technology Upgrades
Regulatory developments are playing a significant role in shaping the future of the computed tomography industry. Governments and healthcare regulators are strengthening radiation protection requirements to enhance patient safety and promote best practices in medical imaging. Updated policy frameworks introduced by organizations including the European Commission require that newly installed CT systems incorporate advanced iterative reconstruction technologies or AI-based denoising capabilities as standard features. These requirements are intended to reduce radiation exposure while maintaining high diagnostic image quality. Advanced reconstruction algorithms allow healthcare providers to perform scans at lower radiation doses without compromising clinical accuracy, supporting ongoing efforts to optimize patient safety. As compliance requirements become more stringent, healthcare facilities are increasingly investing in next-generation CT systems equipped with sophisticated dose-reduction technologies, accelerating modernization across the global computed tomography market.
Computed Tomography Market Trends, Growth Drivers, Competitive Landscape, and Future Opportunities
The global Computed Tomography market is witnessing increasing investments in innovation, product development, digital transformation, artificial intelligence integration, healthcare infrastructure expansion, and strategic partnerships across developed and emerging economies. Key Companies in the industry include- Siemens Healthineers AG, GE HealthCare Technologies Inc., Koninklijke Philips N.V., Canon Medical Systems Corporation, FUJIFILM Holdings Corporation, Shanghai United Imaging Healthcare Co., Ltd., NeuroLogica Corp, Neusoft Medical Systems Co., Ltd., Planmeca Oy, Carestream Health, Inc.. The Computed Tomography market is expected to remain one of the most closely watched segments in the global healthcare industry, with companies focusing on niche market segments. As healthcare systems across the US, Europe, Asia-Pacific, Latin America, and Middle East & Africa continue to prioritize efficiency, access, and innovation, the Computed Tomography industry outlook remains shaped by rising healthcare expenditure, demographic change, digital transformation, and product innovation.
The report provides detailed market analysis including-
-
Growth Computed Tomography Market size outlook across 3 scenarios- High growth, reference, and Low growth cases
-
Market Trends, Drivers, Potential Opportunities, and Challenges faced by Computed Tomography companies
-
Porter’s Five forces analysis- Bargaining power of buyers and sellers, Threat of Substitutes and new entrants, and Intensity of competitive rivalry
-
Detailed SWOT Analysis of global and regional Computed Tomography markets
-
Competitive analysis including business description, product analysis, and financial profiles
-
Key country specific analysis detailing key factors shaping the short-term and long-term outlook
-
Recent industry developments and news including mergers, acquisitions, product launches, expansions, and company announcements
Computed Tomography Market Competitive Benchmarking and Company Analysis
Leading companies in Computed Tomography industry include- Siemens Healthineers AG, GE HealthCare Technologies Inc., Koninklijke Philips N.V., Canon Medical Systems Corporation, FUJIFILM Holdings Corporation, Shanghai United Imaging Healthcare Co., Ltd., NeuroLogica Corp, Neusoft Medical Systems Co., Ltd., Planmeca Oy, Carestream Health, Inc.. The Computed Tomography market remains moderately to highly fragmented, with competition expected to intensify as companies accelerate investments in innovation, geographic expansion, strategic partnerships, and portfolio diversification through 2034. In developed markets such as the United States, Germany, France, the United Kingdom, and Canada, competition is increasingly centered on innovation, reimbursement positioning, and value-based healthcare solutions. Meanwhile, emerging markets including China, India, Brazil, and countries across the Middle East and Africa continue to present significant opportunities for expansion due to rising healthcare expenditure, growing patient populations, and increasing access to healthcare services.
What to expect in US Computed Tomography Markets in 2026 and beyond- Market Size, Share, Growth Rate, and Forecast to 2034
The US healthcare expenditure is forecast to reach $8.2 Trillion in 2034 from $5.5 Trillion in 2026 based on the National Health Expenditure Accounts (NHEA) data. With an aging population, rising chronic disease burden, and increasing migration toward minimally invasive and outpatient care, the Computed Tomography market remains one of the strongest-performing segments in the country.
The US Computed Tomography Companies are opting new business models, optimized pricing models, industry partnerships, and AI-enabled back end transformations to enhance efficiency and cost management. The US Computed Tomography market faces successive waves of challenging trends, with strong opportunities across select segments. The CMS plan to implement Medicaid from 2027 is driving states to build eligibility verification systems throughout 2026. Looking ahead to 2034, we anticipate stronger results underpinned by opportunities exist across Computed Tomography industry. On the medical device front, over 7,000 device manufacturers continue to gain from increasing demand from demand for implantable devices, surgical instruments, monitoring equipment, and diagnostic systems.
Canada- Proximity to the US and healthcare similarities to EU5 countries fuel sales of Canadian Computed Tomography markets
Canada's strong Computed Tomography sales performance is underpinned by an aging population and a well-developed healthcare infrastructure. Steady growth in new brand spending in rural and urban locations fuel the long-term prospects of small and medium-sized enterprises across medical, diagnostic, and therapeutic devices. The Canadian Computed Tomography market presents significant opportunities for U.S. exporters of medical devices, with the U.S. being Canada’s largest trading partner for this sector. Potential advantages including specialized materials, advanced manufacturing techniques, and digital technologies support the launch of new products in the country.
Germany Computed Tomography Trends and Perspectives to 2034- Financial sustainability, hospital restructuring, demographic pressures, and digitization of care delivery continue to shape the German healthcare industry.
Germany continues to remain the largest Computed Tomography market in Europe, driven by over €600 Billion healthcare expenditure, €12 Billion medical device R&D expenditure, statutory health insurance system covering 90% German population, nationwide rollout of the electronic patient record (ePA), and large-volume of Computed Tomography population. In particular, Research and development in Germany fuels the commercialization of cutting-edge technologies. Companies across the Germany Computed Tomography industry value chain are focusing on both domestic markets and exports. The country is also driving digital adoption with the Hospital Future Act driving hospitals to upgrade their information systems by 2027. Over the forecast period, aging population, rising healthcare costs, and increasing procedural volumes drive the Computed Tomography market outlook.
France Market Size, Growth Rate, and Forecast Analysis to 2034- Universal healthcare system, high public healthcare expenditure, and strong government support Computed Tomography sales through 2034
France Computed Tomography companies are emphasizing on opportunities for rapid, at-scale innovation to boost profitability over the long-term. The country’s National Health Insurance spending target (ONDAM) estimates 3.7% growth in the country’s healthcare expenditure. Over the forecast period, expenditure control measures, chronic disease management initiatives, workforce reforms, and efforts to improve system efficiency drive the long-term prospects.
The biggest 2026 policy frame is the PLFSS 2026. The law sets the Maladie branch spending target at €271.4 billion for 2026 and fixes the ONDAM at €117.5 billion for city care, €112.8 billion for health establishments, and €18.3 billion for elderly-care establishments and services. France’s market is also being pulled by demographics. INSEE estimates that on 1 January 2026 France had 69.1 million inhabitants, with 22% aged 65 or over. INSEE also reported that 2025 births were 645,000 and deaths were 651,000, producing a negative natural balance of about 6,000 for the first time since the end of the Second World War.
UK Computed Tomography Market Size, Share, and Growth Projections to 2034- Rapid growth driven by new and existing brands across the industry value chain
Small high-need consumer segments remain key priority of Computed Tomography distributors in the UK industry. Continuous launch of new products coupled with high expenditures support the market outlook. The UK Government financing remains the dominant funding source at 81.3% of total healthcare expenditure, or £280 billion in 2025. According to the ONS, total healthcare spending grew 7.7% nominally and 3.9% in real terms from 2024 to 2025. Similarly, out-of-pocket spending was £49 billion (14.1%) and voluntary health insurance was £9.5 billion (2.8%). The market is driven by rapid digital adoption with NHS England’s plan to give more than 500,000 staff access to new AI tools.
China Computed Tomography Market Growth Drivers, Revenue Trends, and Forecast- Medical insurance coverage is rapidly expanding over the past few years
China Computed Tomography market is undergoing a structural shift from hospital-centric care toward a more integrated system emphasizing primary care, outpatient services, and long-term care. Chinese local players are emerging as a strong pillar of Computed Tomography industry, offering opportunities for both competition and partnership. Over the forecast period, new and innovative product launches remain key elements driving market outlook. China's healthcare industry is increasingly centered on expanding healthcare capacity, improving access to advanced treatments, and reducing dependence on imported technologies.
The National Healthcare Security Administration reported that by end-2024, China’s basic medical insurance covered 1.32662 billion people and the coverage rate was 95%. Regional disparities in consumer spending trends continue to become more pronounced in the Chinese Computed Tomography industry. Over the forecast period, demand will keep shifting toward geriatrics, chronic disease management, rehabilitation, long-term care, and outpatient care, while pricing pressure will remain intense in drugs and consumables because reimbursement.
India Computed Tomography Market Landscape: Current Size and Long-Term Growth Outlook - Increased pricing pressures in US market is encouraging domestic vendors to expand across India
Indian Computed Tomography market is witnessing the rapid emergence of an ecosystem that brings together diverse companies across the industry value chain. Further, large-scale healthcare public and private investments and a steady growth in chronic conditions is driving sales of pharmaceuticals and medical devices. Further, non-retail channel is experiencing volume decrease and patients are migrating to the retail. Indian medical device firms are also combining precision engineering with lower labor costs to make world-class diagnostics, robotics, and critical care devices.
Brazil Computed Tomography market remains price-driven, with products domestically manufactured and accessibility offering potential opportunities
Healthcare expenditure in Brazil exceeds 10% of GDP, with the country among the highest healthcare spenders in Latin America. ANS reported 53.2 million medical-plan beneficiaries in December 2025, while IBGE projects a steady rise in older-age cohorts, with people aged 60+ already representing about 23% of the population. The price sensitive market access is broad through the public system, private coverage adds a sizeable premium layer, and reimbursement, procurement, and hospital efficiency remain key buying drivers.
Middle East and Africa Computed Tomography Industry Trends and Perspectives to 2034
According to the World Bank, the Middle East and North Africa population exceeds 500 million, while Sub-Saharan Africa's population exceeds 1.2 billion, making the broader MEA region one of the fastest-growing healthcare demand centers globally. The GCC countries including Saudi Arabia, United Arab Emirates, Qatar, and Kuwait continue to account for a disproportionately large share of regional healthcare spending. Government-led programs such as Saudi Arabia's Vision 2030 are accelerating investments in hospital infrastructure, private-sector participation, medical technology adoption, and healthcare digitalization. On the other hand, South Africa, Egypt, Nigeria, and Kenya remain key healthcare markets due to their large populations, expanding private healthcare sectors, and growing investments in healthcare delivery systems.
Computed Tomography Market Segmentation
By Component
Hardware Systems
Software & AI Integration Platforms
Services
By Slice Count
Low-Slice CT Scanners
Mid-Slice CT Scanners
High-Slice CT Scanners
Cone Beam CT
By Technology Type
Dual-Energy
Photon-Counting CT
Iterative Reconstruction CT
By Modality
Stationary CT Systems
Portable
Hybrid Configurations
By Application
Oncology
Cardiology
Neurology
Musculoskeletal & Trauma
Vascular and Guided Interventions
By End-User
Hospitals and Multi-Specialty Medical Centers
Diagnostic Imaging Centers
Ambulatory Surgical Centers
Top Companies in Computed Tomography Industry
Siemens Healthineers AG
GE HealthCare Technologies Inc.
Koninklijke Philips N.V.
Canon Medical Systems Corporation
FUJIFILM Holdings Corporation
Shanghai United Imaging Healthcare Co., Ltd.
NeuroLogica Corp
Neusoft Medical Systems Co., Ltd.
Planmeca Oy
Carestream Health, Inc.
Countries Included
-
North America- US, Canada, Mexico
-
Europe- Germany, France, UK, Spain, Italy, Nordics, Others
-
Asia Pacific- China, India, Japan, South Korea, Australia, Southeast Asia, Others
-
Latin America- Brazil, Argentina, Others
-
Middle East and Africa- Saudi Arabia, UAE, Other Middle East, South Africa, Other Africa
Latest Market Updates In Healthcare
Support this report with fresh, same-industry updates that strengthen topical depth and internal linking.
Biotech and Fermented Ingredient Integration to gain rapid penetration
The rising geopolitical and tariff-related uncertainties, in particular, amidst United States’ renewed protectionist trade stance continues to driv...
Market UpdateLow MOQ, High-Mix Production Models for Indie & DTC Brands
The rising geopolitical and tariff-related uncertainties, in particular, amidst United States’ renewed protectionist trade stance continues to driv...
By Component
Hardware Systems
Software & AI Integration Platforms
Services
By Slice Count
Low-Slice CT Scanners
Mid-Slice CT Scanners
High-Slice CT Scanners
Cone Beam CT
By Technology Type
Dual-Energy
Photon-Counting CT
Iterative Reconstruction CT
By Modality
Stationary CT Systems
Portable
Hybrid Configurations
By Application
Oncology
Cardiology
Neurology
Musculoskeletal & Trauma
Vascular and Guided Interventions
By End-User
Hospitals and Multi-Specialty Medical Centers
Diagnostic Imaging Centers
Ambulatory Surgical Centers