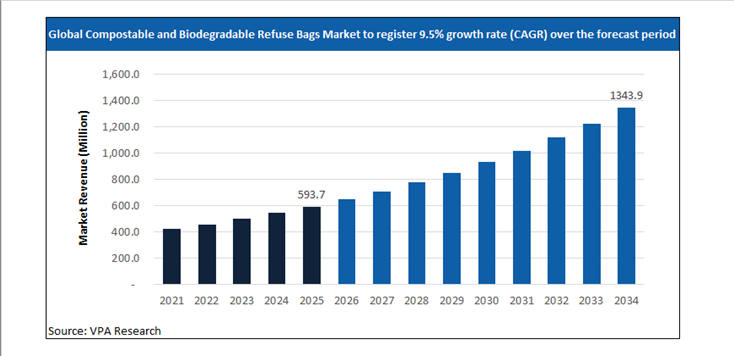
Compostable and Biodegradable Refuse Bags Market Snapshot: Market Size, CAGR, and Growth Outlook to 2032
Global Compostable and Biodegradable Refuse Bags Market Size is projected to hit $1343.7 Million in 2034 at a CAGR of 9.5% from $593.7 Million Million in 2025.
The report analyzes the global Compostable and Biodegradable Refuse Bags Market across diverse segments including By Material Type (Polylactic Acid (PLA), Polybutylene Adipate Terephthalate (PBAT), Starch Blends, Polyhydroxyalkanoates (PHA), Other Bio-polymers), By Product Type (Drawstring Bags, Flap-Tie Bags, Wicketed Bags, Gusseted Bags), By Capacity (Small, Medium, Large, Extra-Large), By End-Use Sector (Residential, Commercial, Institutional, Industrial & Agricultural).
The Compostable and Biodegradable Refuse Bags Market Market at a Glance (2026)
Regulatory Mandates and Municipal Procurement Policies Anchor Market Demand
The compostable and biodegradable refuse bags market is primarily shaped by regulatory intervention and public-sector procurement rather than discretionary consumer behavior. Governments and municipalities across multiple regions are implementing restrictions on conventional plastic bags to address landfill accumulation and organic waste contamination. Compostable refuse bags, designed to break down under controlled composting conditions, are increasingly specified for food waste collection programs, commercial kitchens, hospitality operations, and municipal organic waste streams.
In 2024, European Commission advanced enforcement of single-use plastics regulations, reinforcing demand for certified compostable alternatives in food service and waste management applications. These policies directly influence purchasing behavior among municipalities and institutional buyers, who prioritize compliance with recognized compostability standards over branding or aesthetic considerations. As a result, the market is closely tied to waste collection infrastructure and composting capacity rather than general retail packaging trends.
Material Science, Certification Standards, and Performance Constraints Define Product Viability
Product viability in the compostable and biodegradable refuse bags market depends on material formulation and compliance with strict certification frameworks. Compostable bags are typically produced from bio-based polymers such as polylactic acid blends, starch-based compounds, and other biodegradable resins engineered to degrade under industrial composting conditions. Mechanical strength, puncture resistance, and moisture tolerance remain critical performance parameters, particularly for commercial food waste applications.
Certification standards play a decisive role in market access. In 2025, Biodegradable Products Institute updated guidance affecting compostable bag certification in North America, reinforcing requirements related to disintegration timelines and residue limits. These updates increase the technical burden on manufacturers and favor suppliers with established testing capabilities and documented compliance histories. In parallel, Novamont continued development of certified compostable materials in 2024, supporting refuse bag applications aligned with municipal composting systems.
Supply Chain Discipline, Cost Management, and Regional Infrastructure Shape Competitive Outcomes
The competitive structure of the compostable refuse bags market is shaped by feedstock availability, resin pricing stability, and proximity to end markets. Bio-based polymer supply chains are more sensitive to agricultural inputs and energy costs than conventional plastics, requiring disciplined sourcing and inventory management. Manufacturers serving large municipal contracts must also demonstrate consistent quality and delivery reliability, as refuse bags are operational consumables rather than discretionary products.
In 2024, BioBag announced capacity enhancements aimed at supporting large-scale institutional and municipal demand, reflecting the market’s orientation toward bulk procurement rather than fragmented retail sales. At the same time, infrastructure limitations influence adoption rates. Compostable bags require access to industrial composting facilities capable of processing certified materials, making regional waste management capabilities a critical demand determinant.
North America and Europe represent the most established markets due to regulatory enforcement and composting infrastructure maturity. Asia-Pacific adoption is more uneven, concentrated in urban centers with government-backed organic waste initiatives. In 2025, United Nations Environment Programme continued to support policy frameworks aimed at reducing plastic pollution, indirectly reinforcing long-term demand for certified compostable waste solutions. Across regions, procurement decisions prioritize certification compliance, functional durability, and integration with existing waste systems, positioning compostable refuse bags as regulated infrastructure components rather than lifestyle consumer goods.
Global Compostable and Biodegradable Refuse Bags Market Market Dynamics: Growth Drivers, Restraints, and Opportunities
Strategic Market Drivers: What’s Fueling Growth in 2026?
The Compostable and Biodegradable Refuse Bags Market market report provides a comprehensive assessment of the structural and technical factors shaping the market’s evolution in 2026 and beyond. It evaluates demand-side shifts, supply-side constraints, regulatory influences, and technology-led disruption impacting both established players and new market entrants. The Compostable and Biodegradable Refuse Bags Market market analysis details the impact of changing end-use requirements, evolving customer specifications, and increasing performance expectations across countries. Further, key drivers and opportunities are mapped across regional and application-level dynamics.
Profit Prioritization and Portfolio Rebalancing
-
Asset Rationalization: Tier 1 players are aggressively divesting low-margin, commoditized assets to reallocate capital toward high-purity, differentiated offerings with superior pricing power.
-
Operating Leverage: Amidst persistent raw material volatility, companies are leveraging Digital Twins and AI-driven manufacturing to optimize OpEx.
-
Specialty Transition: Strategic investments are now concentrated in high-growth niches where customized formulations and technical barriers to entry protect EBITDA margins from global overcapacity in basic chemicals.
A Deep Dive into Emerging Market Hubs
Rapid economic growth, coupled with demand for Compostable and Biodegradable Refuse Bags Market are driving the investment focus on these markets. In particular, India, China, Southeast Asia, Brazil, Eastern Europe, and Latin American markets are registering higher than the global average growth rate. The urban population is expected to reach 6 billion by 2045, around 1.3 times the surge from 2023 levels. Rapid industrialization, infrastructure development, urbanization, and expanding domestic consumption are driving above-average demand growth across markets. Leading Compostable and Biodegradable Refuse Bags Market companies are accelerating investments in local manufacturing, regional supply chains, and application-specific product development to capture these opportunities.
Emerging Opportunities: Untapped High-Growth Niches in the Post-Pandemic Recovery
The post-pandemic landscape for the chemical industry shifted from crisis management to strategic opportunity. In 2026, leading companies are focused on supply chain regionalization, the hygiene-sustainability nexus, and the digital leap in R&D. The Compostable and Biodegradable Refuse Bags Market market is witnessing the emergence of niche, high-growth segments driven by evolving customer needs and regulatory drive. Demand for customized formulations, performance-enhancing solutions, and application-specific variants is rising across advanced manufacturing, specialty end-use industries, and sustainability-led applications. The report identifies underpenetrated segments where innovation, technical differentiation, and faster go-to-market strategies can unlock disproportionate value.
Compostable and Biodegradable Refuse Bags Market Market Challenge- Impact of Geopolitical Uncertainty on Market Stability
In 2026, geopolitical risk has become a structural variable shaping the Compostable and Biodegradable Refuse Bags Market market rather than a short-term disruption factor. Ongoing trade realignments between the U.S., China, and the EU, coupled with sanctions regimes, export controls, and industrial policy interventions, are directly influencing sourcing strategies, production footprints, and pricing stability across the Compostable and Biodegradable Refuse Bags Market value chain. Regional disparities in energy pricing, port congestion risks, and shipping route instability are creating uneven cost structures among global Compostable and Biodegradable Refuse Bags Market producers. Accordingly, Compostable and Biodegradable Refuse Bags Market companies with regionally diversified production assets and localized supplier ecosystems are demonstrating higher margin stability compared to export-reliant peers.
Compostable and Biodegradable Refuse Bags Market Market Strategic Assessment: SWOT, Five Forces, and Value Chain Analysis
Scenario analysis
Amidst varying regulations, trade patterns, supply chain dynamics, and market dynamics, the scenario analysis allows firms to stress-test their current business models. The chapter provides three distinct ‘What-If’ pathways for the Compostable and Biodegradable Refuse Bags Market market through 2032- high growth, low growth, and reference cases. The detailed forward-looking assessment ensures that strategic decisions made today remain viable across a range of potential economic and regulatory outcomes.
Value Chain Analysis
The report identifies key players across the Compostable and Biodegradable Refuse Bags Market industry value chain, tracing the flow from procurement to end-user. By understanding supplier dependencies, processing intensity, distribution dynamics, and customer power at each stage, stakeholders can identify opportunities for vertical integration, strategic partnerships, localization, or operational optimization.
Porter’s Five Forces Analysis
The Porter’s Five Forces analysis chapter incorporates quantitative scoring and weighted impact evaluation for each competitive force within the Compostable and Biodegradable Refuse Bags Market market. This section helps objectively measure industry attractiveness, margin sustainability, and competitive risk using a standardized analytical framework. Companies can evaluate the bargaining power of suppliers and buyers, the threat of substitutes and new entrants, and the degree of rivalry among existing players.
Market Segmentation: Historical and Projected Market Revenue Forecast
Revenue Growth Strategies for Compostable and Biodegradable Refuse Bags Market Segments
The report provides the Compostable and Biodegradable Refuse Bags Market market size across By Material Type (Polylactic Acid (PLA), Polybutylene Adipate Terephthalate (PBAT), Starch Blends, Polyhydroxyalkanoates (PHA), Other Bio-polymers), By Product Type (Drawstring Bags, Flap-Tie Bags, Wicketed Bags, Gusseted Bags), By Capacity (Small, Medium, Large, Extra-Large), By End-Use Sector (Residential, Commercial, Institutional, Industrial & Agricultural). Market size outlook across the segments is provided at the global, North America, Europe, Asia Pacific, South and Central America, and the Middle East and African regions. Across each segment, the report analyzes the growth prospects, post-pandemic recovery, and country-specific dynamics.
Regional Outlook for Compostable and Biodegradable Refuse Bags Market Manufacturers
United States Compostable and Biodegradable Refuse Bags Market Market Size and Share Analysis- Evolving Trade Policies and Supply Chain Reshuffling
The United States Compostable and Biodegradable Refuse Bags Market market is being reshaped by evolving trade policies, industrial localization initiatives, and a reconfiguration of global supply chains. The outlook for 2026 is moderately higher relative to 2025, driven by policy-driven sourcing decisions, domestic manufacturing incentives, and strategic supplier realignment.
Global GDP forecasts fell to 3.0% in 2025 and 3.1% in 2026, with US growth slowing to 1.8% and 1.4%, respectively. Tariffs on critical intermediates have added around 0.5 percentage points to core inflation, squeezing the margins of downstream manufacturers. Similarly, an estimated 20% of manufacturers are likely to deploy physical AI to mitigate labor shortages in the US. Over the forecast period, as domestic pricing, margin profiles, and capacity utilization increasingly correlate with U.S.-specific trade exposure, logistics costs, and policy alignment, companies focus significantly on supply-chain optimization.
Canada Compostable and Biodegradable Refuse Bags Market Industry Forecast 2026–2032- Increasing role in North America Supply Chain realignment
Canada’s real GDP growth is projected to average 1.25% to 1.5% in 2026, a modest recovery from the 1.3% growth seen in 2025. Unlike the high-volume commodity focus of previous decades, the current market is driven by high-value specialty segments. Strong end-user demand from Ontario, Alberta, Quebec, British Columbia, and other provinces is shaping the long-term growth strategies. The report analyzes the key market drivers and provides the Canada Compostable and Biodegradable Refuse Bags Market market size outlook over the forecast period to 2032.
Mexico Compostable and Biodegradable Refuse Bags Market - Companies are investing in Nearshoring hubs
Nearshoring into Mexico and Canada is accelerating, with the US-Mexico trade projected to grow by $315 Billion by the end of the decade. The American Chemistry Council (ACC), the National Association of the Chemical Industry of Mexico (ANIQ), and the Chemistry Industry Association of Canada (CIAC) are focusing on renewal and strengthening the USMCA. Geographic proximity to the United States enables just-in-time supply models, making Mexico a strategic production location for downstream chemical derivatives, resin conversion, coatings, adhesives, and formulation-based specialty products.
Germany Continues to Dominate the European Compostable and Biodegradable Refuse Bags Market Industry
German giants are divesting non-core assets and emphasizing specialized applications, technical precision, and high-value customer solutions. For instance, Henkel’s $2.5 billion acquisition of Stahl Holdings in February 2026. Leading Compostable and Biodegradable Refuse Bags Market companies are formulating strategies to mitigate short-term effects, including supply chain disruptions and destocking, and longer-term structural dynamics. Over the long-term future, demand outlook remains steady across key value chains, driving investments in new product launches and widening distribution channels.
UK- Post-Brexit Divergence and Specialized Clusters
The United Kingdom chemical industry in 2026 is shaped by divergent structural forces combining cost pressure with specialization-driven resilience. European natural gas prices remain structurally around 3.5× higher than U.S. levels, constraining energy-intensive bulk chemical economics and accelerating a pivot toward higher-value specialty chemicals, performance materials, and formulation-led production. Industry restructuring across the region is evident, with chemical plant closures in Europe increasing sixfold since 2022, according to Cefic, reinforcing the UK sector’s move away from commodity exposure toward efficiency-focused, technology-enabled operations. At the same time, logistics capacity is expanding, with the UK chemical logistics market growing at roughly 5% annually to reach about $8 billion in 2026, strengthening the country’s role as a storage, distribution, and re-export hub for specialty and regulated chemical flows.
China and India account for over 40% of global demand
China’s Compostable and Biodegradable Refuse Bags Market industry is witnessing rapid capacity expansion, technology-led upgrading, and demand reorientation, with accelerated investment across value chain segments reshaping competitive dynamics. The $1.5 trillion chemical industry remains a primary engine of GDP growth, with a government-mandated target of 5% average annual growth in industrial added value through year-end 2026.
Demand fundamentals are also shifting structurally: by 2030, China and India together are projected to account for 40% of global middle-class consumption, up from less than 10% in 2010, indicating long-term expansion in consumption-driven Compostable and Biodegradable Refuse Bags Market applications. Among end-user markets, Guangdong, Jiangsu, Shandong, Zhejiang, Sichuan, and others are widely focused on by vendors.
India remains a significant outlier with a projected 6.6% GDP growth in 2026, driving a surge in Compostable and Biodegradable Refuse Bags Market demand. The government's $1.4 trillion National Infrastructure Pipeline is a massive driver for the market outlook. The Indian government is expected to expand the Production Linked Incentive (PLI) scheme for specialty chemicals in 2026.
Japan: Maintaining Dominance in High-Performance Segments
Japan’s Compostable and Biodegradable Refuse Bags Market industry in 2026 is concentrated in high-performance, specification-critical segments where technical qualification barriers protect margins. Japan’s chemical sector remains one of the world’s most innovation-dense. In 2026, R&D spending in the sector continues to exceed $2.1 Billion annually, with Tokyo and the Kanto region serving as the global hubs for research. Persistent public-sector funding worth ¥4 trillion has moved capital toward advanced materials. To sustain competitive positioning in the evolving environment, Japanese firms can unlock growth by developing new markets through business model transformation and differentiated customer engagement strategies, reflecting the industry’s shift beyond product-led competition toward solution-oriented value creation.
Southeast Asia: The New Manufacturing Core
Southeast Asia is emerging as a primary manufacturing and chemical production growth zone, supported by industrial policy, infrastructure expansion, and supply chain diversification. Vietnam is advancing sector expansion under its Chemical Industry Development Strategy 2030, targeting average annual industry growth of 10–11% through 2030, with emphasis on petrochemicals, downstream plastics, industrial chemicals, and specialty materials serving electronics, construction, and export manufacturing.
The regional economy continues to be resilient, adapting to the shifting landscape and with momentum varying across countries and sectors. Concurrently, Indonesia is accelerating industrial capacity through its National Medium-Term Development Plan (RPJMN), which includes $414 billion in infrastructure investment, strengthening ports, energy systems, and industrial corridors critical for chemical logistics and processing industries.
Middle East- Rapid Economic Growth Supports Potential Business Expansion Opportunities
The Middle East chemical industry is strengthening its position as a global production and export hub through sustained capital deployment, feedstock integration, and downstream diversification. Between 2023 and the end of 2026, the region is tracking around 160 capital projects valued at more than $55 billion, reflecting continued investment in petrochemicals, polymers, specialty derivatives, and industrial chemicals.
The regulatory environment has become increasingly fragmented across geographies. Abundant hydrocarbon feedstocks, integrated refinery-petrochemical complexes, and export-oriented infrastructure provide structural cost advantages that support both commodity and higher-value chemical chains. In Saudi Arabia, the National Industry Strategy targets a fourfold increase in downstream chemical output by 2035, signaling a shift from base petrochemical exports toward specialty materials, performance polymers, and conversion industries.
Competitive Analysis- Intensity of Competition and Market Share
Companies are increasing R&D expenditures by 2-3% while high-intensity segments are witnessing an 8-9% increase in expenditure. The global Compostable and Biodegradable Refuse Bags Market industry is characterized by intense competition with companies focusing on profit margins through widening end-user applications. Leading companies, including Novamont S.p.A., BASF SE (Ecovio), Berry Global Inc., BioBag International AS, TIPA Corp Ltd. (Israel), EcoSafe 64 (Film-Tech), GreenGood USA, Elevate Packaging, Sphere Group, NaturBag (Natur-Tec), are analyzed in the study. For each company, a detailed business description, SWOT profile, and products and services benchmarking are provided.
Compostable and Biodegradable Refuse Bags Market Market Segmentation
By Material Type
Polylactic Acid (PLA)
Polybutylene Adipate Terephthalate (PBAT)
Starch Blends
Polyhydroxyalkanoates (PHA)
Other Bio-polymers
By Product Type
Drawstring Bags
Flap-Tie Bags
Wicketed Bags
Gusseted Bags
By Capacity
Small
Medium
Large
Extra-Large
By End-Use Sector
Residential
Commercial
Institutional
Industrial & Agricultural
Top companies in the Compostable and Biodegradable Refuse Bags Market industry
Novamont S.p.A.
BASF SE (Ecovio)
Berry Global Inc.
BioBag International AS
TIPA Corp Ltd. (Israel)
EcoSafe 64 (Film-Tech)
GreenGood USA
Elevate Packaging
Sphere Group
NaturBag (Natur-Tec)
Countries Included-
-
North America- US, Canada, Mexico
-
Europe- Germany, France, UK, Spain, Italy, Nordics, Others
-
Asia Pacific- China, India, Japan, South Korea, Australia, Southeast Asia, Others
-
Latin America- Brazil, Argentina, Others
-
Middle East and Africa- Saudi Arabia, UAE, Other Middle East, South Africa, Other Africa
Latest Market Updates In Chemicals
Support this report with fresh, same-industry updates that strengthen topical depth and internal linking.
By Capacity
7 to 20 Gallons
20 to 30 Gallons
30 to 40 Gallons
40 to 55 Gallons
Above 55 Gallons
By Product
Biodegradable
Compostable
By Material
Polylactic Acid (PLA)
Polyhydroxyalkanoate (PHA)
PBS
PBAT
Starch Blends
Cellophane
Paper
By Thickness
0 to 0.7 Mil
7 to 0.9 Mil
0.9 to 1.5 Mil
Above 1.5 Mil
By End-User
Retail and Consumer
Industrial
Institutional