Chelated Agriculture Micronutrients Market Market Snapshot: Market Size, CAGR, and Growth Outlook to 2032
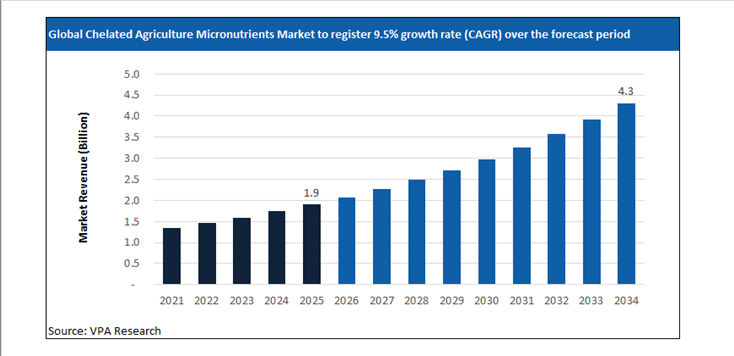
Global Chelated Agriculture Micronutrients Market Size is projected to hit $4.3 Billion in 2034 at a CAGR of 9.5% from $1.9 Billion in 2025.
The report analyzes the global Chelated Agriculture Micronutrients Market Market across diverse segments including By Nutrient Type (Zinc, Iron, Manganese, Copper, Boron, Molybdenum, Others, By Chelating Agent (EDTA, EDDHA, DTPA, IDHA, Biodegradable Chelates, Others, By Form (Dry, Liquid, By Crop Type (Cereals & Grains, Pulses & Oilseeds, Fruits & Vegetables, Turf & Ornamentals, Commercial Crops, By Application Method (Soil Application, Foliar Spray, Fertigation, Seed Treatment).
The Chelated Agriculture Micronutrients Market Market at a Glance (2026)
Precision Fertilization Technologies Reshaping Micronutrient Delivery Systems
The chelated agriculture micronutrients market in 2026 is evolving as precision agriculture becomes structurally embedded across large-scale farming systems. Chelation technology, which binds micronutrients such as zinc, iron, manganese, and boron with organic molecules, is gaining traction due to its ability to improve nutrient stability, solubility, and uptake efficiency under varying soil conditions. Increasing soil degradation, micronutrient depletion, and intensive monocropping practices are accelerating the adoption of advanced micronutrient formulations that can deliver consistent agronomic performance.
A notable shift is the integration of micronutrient delivery with precision farming platforms, including drone-based spraying and fertigation systems. The October 2025 launch by BASF of a chelated zinc-iron blend tailored for drone-compatible application highlights how input manufacturers are aligning product design with evolving farm mechanization. These solutions are engineered to optimize nutrient-use efficiency by minimizing leaching losses and ensuring targeted delivery at critical crop growth stages. This alignment between formulation chemistry and application technology is redefining how micronutrients are deployed in high-yield farming systems, particularly in staple crops such as corn and wheat.
Biological Integration and Next-Generation Nutrient Uptake Mechanisms
The market is also undergoing a transition toward biologically enhanced chelated formulations, driven by the convergence of biotechnology and crop nutrition. The integration of Intrinsyx Bio’s endophyte-based research capabilities into Syngenta’s portfolio has accelerated the development of hybrid solutions that combine chelation chemistry with microbial-assisted nutrient uptake. These formulations are designed to enhance root-level absorption efficiency, particularly in nitrogen-intensive agricultural systems where nutrient antagonism can limit micronutrient availability.
This trend reflects a broader industry movement toward functional fertilizers that go beyond basic nutrient supply to actively influence plant physiology and soil microbiome dynamics. Endophyte-enabled chelated products are being positioned as performance enhancers that can improve nutrient assimilation, stress tolerance, and yield quality. As regulatory scrutiny increases around fertilizer runoff and environmental impact, such biologically integrated solutions are expected to gain further traction, especially in regions with strict sustainability mandates.
Organic Compatibility and Crop-Specific Micronutrient Innovation
Another defining development in the 2026 landscape is the expansion of chelated micronutrients into certified organic farming systems. Corteva Agriscience’s introduction of an organic-approved boron-manganese foliar spray under its Pioneer brand represents a strategic move to capture demand from organic and regenerative agriculture segments. Early 2026 field data from the U.S. Midwest indicates measurable improvements in soybean quality and disease resistance, underscoring the role of micronutrients in enhancing both yield and crop resilience.
Manufacturers are increasingly focusing on crop-specific formulations that address localized deficiencies and agronomic challenges. This includes tailoring chelation agents and nutrient ratios to match soil pH, crop type, and regional climatic conditions. The emphasis on customized nutrient solutions is particularly relevant in emerging agricultural markets, where soil variability and nutrient imbalances are more pronounced. As digital agronomy platforms generate more granular field data, the ability to deliver highly targeted chelated micronutrient solutions is becoming a key competitive differentiator in the global market.
Global Chelated Agriculture Micronutrients Market Market Dynamics: Growth Drivers, Restraints, and Opportunities
Strategic Market Drivers: What’s Fueling Growth in 2026?
The Chelated Agriculture Micronutrients Market market report provides a comprehensive assessment of the structural and technical factors shaping the market’s evolution in 2026 and beyond. It evaluates demand-side shifts, supply-side constraints, regulatory influences, and technology-led disruption impacting both established players and new market entrants. The Chelated Agriculture Micronutrients Market market analysis details the impact of changing end-use requirements, evolving customer specifications, and increasing performance expectations across countries. Further, key drivers and opportunities are mapped across regional and application-level dynamics.
Profit Prioritization and Portfolio Rebalancing
-
Asset Rationalization: Tier 1 players are aggressively divesting low-margin, commoditized assets to reallocate capital toward high-purity, differentiated offerings with superior pricing power.
-
Operating Leverage: Amidst persistent raw material volatility, companies are leveraging Digital Twins and AI-driven manufacturing to optimize OpEx.
-
Specialty Transition: Strategic investments are now concentrated in high-growth niches where customized formulations and technical barriers to entry protect EBITDA margins from global overcapacity in basic chemicals.
A Deep Dive into Emerging Market Hubs
Rapid economic growth, coupled with demand for Chelated Agriculture Micronutrients Market are driving the investment focus on these markets. In particular, India, China, Southeast Asia, Brazil, Eastern Europe, and Latin American markets are registering higher than the global average growth rate. The urban population is expected to reach 6 billion by 2045, around 1.3 times the surge from 2023 levels. Rapid industrialization, infrastructure development, urbanization, and expanding domestic consumption are driving above-average demand growth across markets. Leading Chelated Agriculture Micronutrients Market companies are accelerating investments in local manufacturing, regional supply chains, and application-specific product development to capture these opportunities.
Emerging Opportunities: Untapped High-Growth Niches in the Post-Pandemic Recovery
The post-pandemic landscape for the chemical industry shifted from crisis management to strategic opportunity. In 2026, leading companies are focused on supply chain regionalization, the hygiene-sustainability nexus, and the digital leap in R&D. The Chelated Agriculture Micronutrients Market market is witnessing the emergence of niche, high-growth segments driven by evolving customer needs and regulatory drive. Demand for customized formulations, performance-enhancing solutions, and application-specific variants is rising across advanced manufacturing, specialty end-use industries, and sustainability-led applications. The report identifies underpenetrated segments where innovation, technical differentiation, and faster go-to-market strategies can unlock disproportionate value.
Chelated Agriculture Micronutrients Market Market Challenge- Impact of Geopolitical Uncertainty on Market Stability
In 2026, geopolitical risk has become a structural variable shaping the Chelated Agriculture Micronutrients Market market rather than a short-term disruption factor. Ongoing trade realignments between the U.S., China, and the EU, coupled with sanctions regimes, export controls, and industrial policy interventions, are directly influencing sourcing strategies, production footprints, and pricing stability across the Chelated Agriculture Micronutrients Market value chain. Regional disparities in energy pricing, port congestion risks, and shipping route instability are creating uneven cost structures among global Chelated Agriculture Micronutrients Market producers. Accordingly, Chelated Agriculture Micronutrients Market companies with regionally diversified production assets and localized supplier ecosystems are demonstrating higher margin stability compared to export-reliant peers.
Chelated Agriculture Micronutrients Market Market Strategic Assessment: SWOT, Five Forces, and Value Chain Analysis
Scenario analysis
Amidst varying regulations, trade patterns, supply chain dynamics, and market dynamics, the scenario analysis allows firms to stress-test their current business models. The chapter provides three distinct ‘What-If’ pathways for the Chelated Agriculture Micronutrients Market market through 2032- high growth, low growth, and reference cases. The detailed forward-looking assessment ensures that strategic decisions made today remain viable across a range of potential economic and regulatory outcomes.
Value Chain Analysis
The report identifies key players across the Chelated Agriculture Micronutrients Market industry value chain, tracing the flow from procurement to end-user. By understanding supplier dependencies, processing intensity, distribution dynamics, and customer power at each stage, stakeholders can identify opportunities for vertical integration, strategic partnerships, localization, or operational optimization.
Porter’s Five Forces Analysis
The Porter’s Five Forces analysis chapter incorporates quantitative scoring and weighted impact evaluation for each competitive force within the Chelated Agriculture Micronutrients Market market. This section helps objectively measure industry attractiveness, margin sustainability, and competitive risk using a standardized analytical framework. Companies can evaluate the bargaining power of suppliers and buyers, the threat of substitutes and new entrants, and the degree of rivalry among existing players.
Market Segmentation: Historical and Projected Market Revenue Forecast
Revenue Growth Strategies for Chelated Agriculture Micronutrients Market Segments
The report provides the Chelated Agriculture Micronutrients Market market size across By Nutrient Type (Zinc, Iron, Manganese, Copper, Boron, Molybdenum, Others, By Chelating Agent (EDTA, EDDHA, DTPA, IDHA, Biodegradable Chelates, Others, By Form (Dry, Liquid, By Crop Type (Cereals & Grains, Pulses & Oilseeds, Fruits & Vegetables, Turf & Ornamentals, Commercial Crops, By Application Method (Soil Application, Foliar Spray, Fertigation, Seed Treatment). Market size outlook across the segments is provided at the global, North America, Europe, Asia Pacific, South and Central America, and the Middle East and African regions. Across each segment, the report analyzes the growth prospects, post-pandemic recovery, and country-specific dynamics.
Regional Outlook for Chelated Agriculture Micronutrients Market Manufacturers
United States Chelated Agriculture Micronutrients Market Market Size and Share Analysis- Evolving Trade Policies and Supply Chain Reshuffling
The United States Chelated Agriculture Micronutrients Market market is being reshaped by evolving trade policies, industrial localization initiatives, and a reconfiguration of global supply chains. The outlook for 2026 is moderately higher relative to 2025, driven by policy-driven sourcing decisions, domestic manufacturing incentives, and strategic supplier realignment.
Global GDP forecasts fell to 3.0% in 2025 and 3.1% in 2026, with US growth slowing to 1.8% and 1.4%, respectively. Tariffs on critical intermediates have added around 0.5 percentage points to core inflation, squeezing the margins of downstream manufacturers. Similarly, an estimated 20% of manufacturers are likely to deploy physical AI to mitigate labor shortages in the US. Over the forecast period, as domestic pricing, margin profiles, and capacity utilization increasingly correlate with U.S.-specific trade exposure, logistics costs, and policy alignment, companies focus significantly on supply-chain optimization.
Canada Chelated Agriculture Micronutrients Market Industry Forecast 2026–2032- Increasing role in North America Supply Chain realignment
Canada’s real GDP growth is projected to average 1.25% to 1.5% in 2026, a modest recovery from the 1.3% growth seen in 2025. Unlike the high-volume commodity focus of previous decades, the current market is driven by high-value specialty segments. Strong end-user demand from Ontario, Alberta, Quebec, British Columbia, and other provinces is shaping the long-term growth strategies. The report analyzes the key market drivers and provides the Canada Chelated Agriculture Micronutrients Market market size outlook over the forecast period to 2032.
Mexico Chelated Agriculture Micronutrients Market - Companies are investing in Nearshoring hubs
Nearshoring into Mexico and Canada is accelerating, with the US-Mexico trade projected to grow by $315 Billion by the end of the decade. The American Chemistry Council (ACC), the National Association of the Chemical Industry of Mexico (ANIQ), and the Chemistry Industry Association of Canada (CIAC) are focusing on renewal and strengthening the USMCA. Geographic proximity to the United States enables just-in-time supply models, making Mexico a strategic production location for downstream chemical derivatives, resin conversion, coatings, adhesives, and formulation-based specialty products.
Germany Continues to Dominate the European Chelated Agriculture Micronutrients Market Industry
German giants are divesting non-core assets and emphasizing specialized applications, technical precision, and high-value customer solutions. For instance, Henkel’s $2.5 billion acquisition of Stahl Holdings in February 2026. Leading Chelated Agriculture Micronutrients Market companies are formulating strategies to mitigate short-term effects, including supply chain disruptions and destocking, and longer-term structural dynamics. Over the long-term future, demand outlook remains steady across key value chains, driving investments in new product launches and widening distribution channels.
UK- Post-Brexit Divergence and Specialized Clusters
The United Kingdom chemical industry in 2026 is shaped by divergent structural forces combining cost pressure with specialization-driven resilience. European natural gas prices remain structurally around 3.5× higher than U.S. levels, constraining energy-intensive bulk chemical economics and accelerating a pivot toward higher-value specialty chemicals, performance materials, and formulation-led production. Industry restructuring across the region is evident, with chemical plant closures in Europe increasing sixfold since 2022, according to Cefic, reinforcing the UK sector’s move away from commodity exposure toward efficiency-focused, technology-enabled operations. At the same time, logistics capacity is expanding, with the UK chemical logistics market growing at roughly 5% annually to reach about $8 billion in 2026, strengthening the country’s role as a storage, distribution, and re-export hub for specialty and regulated chemical flows.
China and India account for over 40% of global demand
China’s Chelated Agriculture Micronutrients Market industry is witnessing rapid capacity expansion, technology-led upgrading, and demand reorientation, with accelerated investment across value chain segments reshaping competitive dynamics. The $1.5 trillion chemical industry remains a primary engine of GDP growth, with a government-mandated target of 5% average annual growth in industrial added value through year-end 2026.
Demand fundamentals are also shifting structurally: by 2030, China and India together are projected to account for 40% of global middle-class consumption, up from less than 10% in 2010, indicating long-term expansion in consumption-driven Chelated Agriculture Micronutrients Market applications. Among end-user markets, Guangdong, Jiangsu, Shandong, Zhejiang, Sichuan, and others are widely focused on by vendors.
India remains a significant outlier with a projected 6.6% GDP growth in 2026, driving a surge in Chelated Agriculture Micronutrients Market demand. The government's $1.4 trillion National Infrastructure Pipeline is a massive driver for the market outlook. The Indian government is expected to expand the Production Linked Incentive (PLI) scheme for specialty chemicals in 2026.
Japan: Maintaining Dominance in High-Performance Segments
Japan’s Chelated Agriculture Micronutrients Market industry in 2026 is concentrated in high-performance, specification-critical segments where technical qualification barriers protect margins. Japan’s chemical sector remains one of the world’s most innovation-dense. In 2026, R&D spending in the sector continues to exceed $2.1 Billion annually, with Tokyo and the Kanto region serving as the global hubs for research. Persistent public-sector funding worth ¥4 trillion has moved capital toward advanced materials. To sustain competitive positioning in the evolving environment, Japanese firms can unlock growth by developing new markets through business model transformation and differentiated customer engagement strategies, reflecting the industry’s shift beyond product-led competition toward solution-oriented value creation.
Southeast Asia: The New Manufacturing Core
Southeast Asia is emerging as a primary manufacturing and chemical production growth zone, supported by industrial policy, infrastructure expansion, and supply chain diversification. Vietnam is advancing sector expansion under its Chemical Industry Development Strategy 2030, targeting average annual industry growth of 10–11% through 2030, with emphasis on petrochemicals, downstream plastics, industrial chemicals, and specialty materials serving electronics, construction, and export manufacturing.
The regional economy continues to be resilient, adapting to the shifting landscape and with momentum varying across countries and sectors. Concurrently, Indonesia is accelerating industrial capacity through its National Medium-Term Development Plan (RPJMN), which includes $414 billion in infrastructure investment, strengthening ports, energy systems, and industrial corridors critical for chemical logistics and processing industries.
Middle East- Rapid Economic Growth Supports Potential Business Expansion Opportunities
The Middle East chemical industry is strengthening its position as a global production and export hub through sustained capital deployment, feedstock integration, and downstream diversification. Between 2023 and the end of 2026, the region is tracking around 160 capital projects valued at more than $55 billion, reflecting continued investment in petrochemicals, polymers, specialty derivatives, and industrial chemicals.
The regulatory environment has become increasingly fragmented across geographies. Abundant hydrocarbon feedstocks, integrated refinery-petrochemical complexes, and export-oriented infrastructure provide structural cost advantages that support both commodity and higher-value chemical chains. In Saudi Arabia, the National Industry Strategy targets a fourfold increase in downstream chemical output by 2035, signaling a shift from base petrochemical exports toward specialty materials, performance polymers, and conversion industries.
Competitive Analysis- Intensity of Competition and Market Share
Companies are increasing R&D expenditures by 2-3% while high-intensity segments are witnessing an 8-9% increase in expenditure. The global Chelated Agriculture Micronutrients Market industry is characterized by intense competition with companies focusing on profit margins through widening end-user applications. Leading companies, including BASF SE, Yara International ASA, Nouryon, Syngenta Group, The Mosaic Company, ICL Group Ltd. (Haifa Group), Coromandel International Limited, Nufarm Limited, Valagro S.p.A. (Syngenta subsidiary), Zuari Agro Chemicals Ltd., are analyzed in the study. For each company, a detailed business description, SWOT profile, and products and services benchmarking are provided.
Chelated Agriculture Micronutrients Market Market Segmentation
By Nutrient Type
Zinc
Iron
Manganese
Copper
Boron
Molybdenum
Others
By Chelating Agent
EDTA
EDDHA
DTPA
IDHA
Biodegradable Chelates
Others
By Form
Dry
Liquid
By Crop Type
Cereals & Grains
Pulses & Oilseeds
Fruits & Vegetables
Turf & Ornamentals
Commercial Crops
By Application Method
Soil Application
Foliar Spray
Fertigation
Seed Treatment
Top companies in the Chelated Agriculture Micronutrients Market industry
BASF SE
Yara International ASA
Nouryon
Syngenta Group
The Mosaic Company
ICL Group Ltd. (Haifa Group)
Coromandel International Limited
Nufarm Limited
Valagro S.p.A. (Syngenta subsidiary)
Zuari Agro Chemicals Ltd.
Countries Included-
-
North America- US, Canada, Mexico
-
Europe- Germany, France, UK, Spain, Italy, Nordics, Others
-
Asia Pacific- China, India, Japan, South Korea, Australia, Southeast Asia, Others
-
Latin America- Brazil, Argentina, Others
-
Middle East and Africa- Saudi Arabia, UAE, Other Middle East, South Africa, Other Africa
Latest Market Updates In Chemicals
Support this report with fresh, same-industry updates that strengthen topical depth and internal linking.
By Nutrient Type
Zinc
Iron
Manganese
Copper
Boron
Molybdenum
Others
By Chelating Agent
EDTA
EDDHA
DTPA
IDHA
Biodegradable Chelates
Others
By Form
Dry
Liquid
By Crop Type
Cereals & Grains
Pulses & Oilseeds
Fruits & Vegetables
Turf & Ornamentals
Commercial Crops
By Application Method
Soil Application
Foliar Spray
Fertigation
Seed Treatment