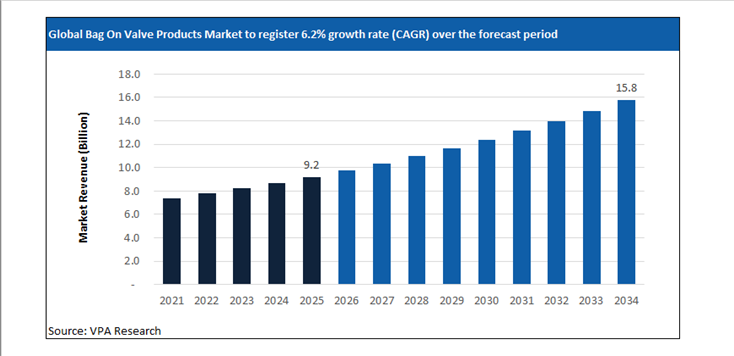
Bag On Valve Products Market Snapshot: Market Size, CAGR, and Growth Outlook to 2032
Global Bag On Valve Products Market Size is projected to hit $15.8 Billion in 2034 at a CAGR of 6.2% from $9.2 Billion Million in 2025.
The report analyzes the global Bag On Valve Products Market across diverse segments including By Product Type (Aerosol BOV, Standard BOV, Specialty BOV, Non-Aerosol BOV), By Container Type (Aluminum Cans, Tinplate Cans, Plastic Containers, Steel & Glass), By Application (Pharmaceuticals, Cosmetics & Personal Care, Food & Beverage, Household Care, Automotive & Industrial).
The Bag On Valve Products Market Market at a Glance (2026)
Bag-on-Valve Products Market Structured by Product Integrity, Aerosol Regulation, and Pharmaceutical Adoption
The bag-on-valve products market in 2026 is defined by its ability to deliver controlled dispensing, full product evacuation, and high formulation protection across regulated end uses. Unlike conventional aerosols, bag-on-valve systems physically separate the product from the propellant, enabling 360-degree dispensing, reduced contamination risk, and compatibility with sensitive formulations. These functional advantages have moved BOV systems from niche packaging to preferred formats in pharmaceuticals, medical devices, cosmetics, and selected food applications where hygiene, dosage accuracy, and regulatory compliance are non-negotiable.
Regulatory pressure on conventional aerosols remains a structural driver. Restrictions on volatile organic compounds and scrutiny of hydrocarbon propellants are pushing brand owners toward alternative dispensing technologies. In May 2024, the European Chemicals Agency reaffirmed reporting and risk-management expectations for aerosol propellants under REACH, reinforcing the attractiveness of compressed air and nitrogen-based BOV systems that avoid direct product–propellant interaction. This regulatory posture continues to influence packaging format decisions in Europe and has downstream effects on global product portfolios.
Expansion in Pharmaceutical, Medical, and Personal Care Applications
Pharmaceutical and medical applications represent the most technically demanding segment of the global bag-on-valve products market. BOV systems are increasingly specified for wound care sprays, nasal saline solutions, dermatological products, and topical antiseptics due to their ability to maintain sterility without preservatives. These products must comply with pharmacopoeia standards, container-closure integrity testing, and validated shelf-life performance.
In February 2025, Aptar Pharma announced expanded production capacity for advanced BOV dispensing systems at its European manufacturing site, citing increased demand from pharmaceutical and healthcare customers. The expansion focused on high-precision valve assemblies and clean-room manufacturing, underscoring how pharmaceutical adoption is raising technical and capital requirements across the BOV supply chain.
Personal care brands are also accelerating adoption, particularly for sun care, hair care, and dermocosmetic products. BOV packaging enables fine misting, reduced preservatives, and near-complete product evacuation, improving both user experience and sustainability metrics. In September 2024, Coster Group introduced a new generation of BOV valves optimized for cosmetic formulations with varying viscosities, highlighting continued product-level innovation driven by formulation complexity rather than marketing differentiation.
Sustainability Positioning, Propellant Choice, and Supply Chain Discipline
Sustainability positioning in the bag-on-valve products market is nuanced. While BOV systems can reduce product waste and enable compressed air propellants, they still rely on multi-component assemblies that complicate recycling. Regulators and brand owners are increasingly scrutinizing lifecycle performance rather than headline sustainability claims.
In June 2024, the European Commission advanced proposals under its packaging waste framework emphasizing recyclability and material reduction, indirectly affecting BOV component design. Suppliers are responding by reducing metal thickness, optimizing bag materials, and improving disassembly characteristics. However, changes are incremental due to strict performance and safety validation requirements.
Supply chain discipline is tightening. BOV systems require precise integration of cans, valves, bags, and filling equipment, limiting supplier substitution. In November 2024, Lindal Group reported continued investment in global manufacturing redundancy for aerosol and BOV components to support pharmaceutical and personal care customers requiring uninterrupted supply. This highlights how resilience and quality assurance are becoming decisive competitive factors.
Global Bag On Valve Products Market Market Dynamics: Growth Drivers, Restraints, and Opportunities
Strategic Market Drivers: What’s Fueling Growth in 2026?
The Bag On Valve Products Market market report provides a comprehensive assessment of the structural and technical factors shaping the market’s evolution in 2026 and beyond. It evaluates demand-side shifts, supply-side constraints, regulatory influences, and technology-led disruption impacting both established players and new market entrants. The Bag On Valve Products Market market analysis details the impact of changing end-use requirements, evolving customer specifications, and increasing performance expectations across countries. Further, key drivers and opportunities are mapped across regional and application-level dynamics.
Profit Prioritization and Portfolio Rebalancing
-
Asset Rationalization: Tier 1 players are aggressively divesting low-margin, commoditized assets to reallocate capital toward high-purity, differentiated offerings with superior pricing power.
-
Operating Leverage: Amidst persistent raw material volatility, companies are leveraging Digital Twins and AI-driven manufacturing to optimize OpEx.
-
Specialty Transition: Strategic investments are now concentrated in high-growth niches where customized formulations and technical barriers to entry protect EBITDA margins from global overcapacity in basic chemicals.
A Deep Dive into Emerging Market Hubs
Rapid economic growth, coupled with demand for Bag On Valve Products Market are driving the investment focus on these markets. In particular, India, China, Southeast Asia, Brazil, Eastern Europe, and Latin American markets are registering higher than the global average growth rate. The urban population is expected to reach 6 billion by 2045, around 1.3 times the surge from 2023 levels. Rapid industrialization, infrastructure development, urbanization, and expanding domestic consumption are driving above-average demand growth across markets. Leading Bag On Valve Products Market companies are accelerating investments in local manufacturing, regional supply chains, and application-specific product development to capture these opportunities.
Emerging Opportunities: Untapped High-Growth Niches in the Post-Pandemic Recovery
The post-pandemic landscape for the chemical industry shifted from crisis management to strategic opportunity. In 2026, leading companies are focused on supply chain regionalization, the hygiene-sustainability nexus, and the digital leap in R&D. The Bag On Valve Products Market market is witnessing the emergence of niche, high-growth segments driven by evolving customer needs and regulatory drive. Demand for customized formulations, performance-enhancing solutions, and application-specific variants is rising across advanced manufacturing, specialty end-use industries, and sustainability-led applications. The report identifies underpenetrated segments where innovation, technical differentiation, and faster go-to-market strategies can unlock disproportionate value.
Bag On Valve Products Market Market Challenge- Impact of Geopolitical Uncertainty on Market Stability
In 2026, geopolitical risk has become a structural variable shaping the Bag On Valve Products Market market rather than a short-term disruption factor. Ongoing trade realignments between the U.S., China, and the EU, coupled with sanctions regimes, export controls, and industrial policy interventions, are directly influencing sourcing strategies, production footprints, and pricing stability across the Bag On Valve Products Market value chain. Regional disparities in energy pricing, port congestion risks, and shipping route instability are creating uneven cost structures among global Bag On Valve Products Market producers. Accordingly, Bag On Valve Products Market companies with regionally diversified production assets and localized supplier ecosystems are demonstrating higher margin stability compared to export-reliant peers.
Bag On Valve Products Market Market Strategic Assessment: SWOT, Five Forces, and Value Chain Analysis
Scenario analysis
Amidst varying regulations, trade patterns, supply chain dynamics, and market dynamics, the scenario analysis allows firms to stress-test their current business models. The chapter provides three distinct ‘What-If’ pathways for the Bag On Valve Products Market market through 2032- high growth, low growth, and reference cases. The detailed forward-looking assessment ensures that strategic decisions made today remain viable across a range of potential economic and regulatory outcomes.
Value Chain Analysis
The report identifies key players across the Bag On Valve Products Market industry value chain, tracing the flow from procurement to end-user. By understanding supplier dependencies, processing intensity, distribution dynamics, and customer power at each stage, stakeholders can identify opportunities for vertical integration, strategic partnerships, localization, or operational optimization.
Porter’s Five Forces Analysis
The Porter’s Five Forces analysis chapter incorporates quantitative scoring and weighted impact evaluation for each competitive force within the Bag On Valve Products Market market. This section helps objectively measure industry attractiveness, margin sustainability, and competitive risk using a standardized analytical framework. Companies can evaluate the bargaining power of suppliers and buyers, the threat of substitutes and new entrants, and the degree of rivalry among existing players.
Market Segmentation: Historical and Projected Market Revenue Forecast
Revenue Growth Strategies for Bag On Valve Products Market Segments
The report provides the Bag On Valve Products Market market size across By Product Type (Aerosol BOV, Standard BOV, Specialty BOV, Non-Aerosol BOV), By Container Type (Aluminum Cans, Tinplate Cans, Plastic Containers, Steel & Glass), By Application (Pharmaceuticals, Cosmetics & Personal Care, Food & Beverage, Household Care, Automotive & Industrial). Market size outlook across the segments is provided at the global, North America, Europe, Asia Pacific, South and Central America, and the Middle East and African regions. Across each segment, the report analyzes the growth prospects, post-pandemic recovery, and country-specific dynamics.
Regional Outlook for Bag On Valve Products Market Manufacturers
United States Bag On Valve Products Market Market Size and Share Analysis- Evolving Trade Policies and Supply Chain Reshuffling
The United States Bag On Valve Products Market market is being reshaped by evolving trade policies, industrial localization initiatives, and a reconfiguration of global supply chains. The outlook for 2026 is moderately higher relative to 2025, driven by policy-driven sourcing decisions, domestic manufacturing incentives, and strategic supplier realignment.
Global GDP forecasts fell to 3.0% in 2025 and 3.1% in 2026, with US growth slowing to 1.8% and 1.4%, respectively. Tariffs on critical intermediates have added around 0.5 percentage points to core inflation, squeezing the margins of downstream manufacturers. Similarly, an estimated 20% of manufacturers are likely to deploy physical AI to mitigate labor shortages in the US. Over the forecast period, as domestic pricing, margin profiles, and capacity utilization increasingly correlate with U.S.-specific trade exposure, logistics costs, and policy alignment, companies focus significantly on supply-chain optimization.
Canada Bag On Valve Products Market Industry Forecast 2026–2032- Increasing role in North America Supply Chain realignment
Canada’s real GDP growth is projected to average 1.25% to 1.5% in 2026, a modest recovery from the 1.3% growth seen in 2025. Unlike the high-volume commodity focus of previous decades, the current market is driven by high-value specialty segments. Strong end-user demand from Ontario, Alberta, Quebec, British Columbia, and other provinces is shaping the long-term growth strategies. The report analyzes the key market drivers and provides the Canada Bag On Valve Products Market market size outlook over the forecast period to 2032.
Mexico Bag On Valve Products Market - Companies are investing in Nearshoring hubs
Nearshoring into Mexico and Canada is accelerating, with the US-Mexico trade projected to grow by $315 Billion by the end of the decade. The American Chemistry Council (ACC), the National Association of the Chemical Industry of Mexico (ANIQ), and the Chemistry Industry Association of Canada (CIAC) are focusing on renewal and strengthening the USMCA. Geographic proximity to the United States enables just-in-time supply models, making Mexico a strategic production location for downstream chemical derivatives, resin conversion, coatings, adhesives, and formulation-based specialty products.
Germany Continues to Dominate the European Bag On Valve Products Market Industry
German giants are divesting non-core assets and emphasizing specialized applications, technical precision, and high-value customer solutions. For instance, Henkel’s $2.5 billion acquisition of Stahl Holdings in February 2026. Leading Bag On Valve Products Market companies are formulating strategies to mitigate short-term effects, including supply chain disruptions and destocking, and longer-term structural dynamics. Over the long-term future, demand outlook remains steady across key value chains, driving investments in new product launches and widening distribution channels.
UK- Post-Brexit Divergence and Specialized Clusters
The United Kingdom chemical industry in 2026 is shaped by divergent structural forces combining cost pressure with specialization-driven resilience. European natural gas prices remain structurally around 3.5× higher than U.S. levels, constraining energy-intensive bulk chemical economics and accelerating a pivot toward higher-value specialty chemicals, performance materials, and formulation-led production. Industry restructuring across the region is evident, with chemical plant closures in Europe increasing sixfold since 2022, according to Cefic, reinforcing the UK sector’s move away from commodity exposure toward efficiency-focused, technology-enabled operations. At the same time, logistics capacity is expanding, with the UK chemical logistics market growing at roughly 5% annually to reach about $8 billion in 2026, strengthening the country’s role as a storage, distribution, and re-export hub for specialty and regulated chemical flows.
China and India account for over 40% of global demand
China’s Bag On Valve Products Market industry is witnessing rapid capacity expansion, technology-led upgrading, and demand reorientation, with accelerated investment across value chain segments reshaping competitive dynamics. The $1.5 trillion chemical industry remains a primary engine of GDP growth, with a government-mandated target of 5% average annual growth in industrial added value through year-end 2026.
Demand fundamentals are also shifting structurally: by 2030, China and India together are projected to account for 40% of global middle-class consumption, up from less than 10% in 2010, indicating long-term expansion in consumption-driven Bag On Valve Products Market applications. Among end-user markets, Guangdong, Jiangsu, Shandong, Zhejiang, Sichuan, and others are widely focused on by vendors.
India remains a significant outlier with a projected 6.6% GDP growth in 2026, driving a surge in Bag On Valve Products Market demand. The government's $1.4 trillion National Infrastructure Pipeline is a massive driver for the market outlook. The Indian government is expected to expand the Production Linked Incentive (PLI) scheme for specialty chemicals in 2026.
Japan: Maintaining Dominance in High-Performance Segments
Japan’s Bag On Valve Products Market industry in 2026 is concentrated in high-performance, specification-critical segments where technical qualification barriers protect margins. Japan’s chemical sector remains one of the world’s most innovation-dense. In 2026, R&D spending in the sector continues to exceed $2.1 Billion annually, with Tokyo and the Kanto region serving as the global hubs for research. Persistent public-sector funding worth ¥4 trillion has moved capital toward advanced materials. To sustain competitive positioning in the evolving environment, Japanese firms can unlock growth by developing new markets through business model transformation and differentiated customer engagement strategies, reflecting the industry’s shift beyond product-led competition toward solution-oriented value creation.
Southeast Asia: The New Manufacturing Core
Southeast Asia is emerging as a primary manufacturing and chemical production growth zone, supported by industrial policy, infrastructure expansion, and supply chain diversification. Vietnam is advancing sector expansion under its Chemical Industry Development Strategy 2030, targeting average annual industry growth of 10–11% through 2030, with emphasis on petrochemicals, downstream plastics, industrial chemicals, and specialty materials serving electronics, construction, and export manufacturing.
The regional economy continues to be resilient, adapting to the shifting landscape and with momentum varying across countries and sectors. Concurrently, Indonesia is accelerating industrial capacity through its National Medium-Term Development Plan (RPJMN), which includes $414 billion in infrastructure investment, strengthening ports, energy systems, and industrial corridors critical for chemical logistics and processing industries.
Middle East- Rapid Economic Growth Supports Potential Business Expansion Opportunities
The Middle East chemical industry is strengthening its position as a global production and export hub through sustained capital deployment, feedstock integration, and downstream diversification. Between 2023 and the end of 2026, the region is tracking around 160 capital projects valued at more than $55 billion, reflecting continued investment in petrochemicals, polymers, specialty derivatives, and industrial chemicals.
The regulatory environment has become increasingly fragmented across geographies. Abundant hydrocarbon feedstocks, integrated refinery-petrochemical complexes, and export-oriented infrastructure provide structural cost advantages that support both commodity and higher-value chemical chains. In Saudi Arabia, the National Industry Strategy targets a fourfold increase in downstream chemical output by 2035, signaling a shift from base petrochemical exports toward specialty materials, performance polymers, and conversion industries.
Competitive Analysis- Intensity of Competition and Market Share
Companies are increasing R&D expenditures by 2-3% while high-intensity segments are witnessing an 8-9% increase in expenditure. The global Bag On Valve Products Market industry is characterized by intense competition with companies focusing on profit margins through widening end-user applications. Leading companies, including AptarGroup, Inc., LINDAL Group Holding GmbH, Precision Valve Corporation, Coster Tecnologie Speciali S.p.A., KOH-I-NOOR Mladá Vožice a.s. (Czech Republic), Summit Packaging Systems, Inc., Toyo & Deutsche Aerosol GmbH, Chicago Aerosol, LLC, Aurena Laboratories, Gualapack S.p.A., are analyzed in the study. For each company, a detailed business description, SWOT profile, and products and services benchmarking are provided.
Bag On Valve Products Market Market Segmentation
By Product Type
Aerosol BOV
Standard BOV
Specialty BOV
Non-Aerosol BOV
By Container Type
Aluminum Cans
Tinplate Cans
Plastic Containers
Steel & Glass
By Application
Pharmaceuticals
Cosmetics & Personal Care
Food & Beverage
Household Care
Automotive & Industrial
Top companies in the Bag On Valve Products Market industry
AptarGroup
Inc.
LINDAL Group Holding GmbH
Precision Valve Corporation
Coster Tecnologie Speciali S.p.A.
KOH-I-NOOR Mladá Vožice a.s. (Czech Republic)
Summit Packaging Systems
Inc.
Toyo & Deutsche Aerosol GmbH
Chicago Aerosol
LLC
Aurena Laboratories
Gualapack S.p.A.
Countries Included-
-
North America- US, Canada, Mexico
-
Europe- Germany, France, UK, Spain, Italy, Nordics, Others
-
Asia Pacific- China, India, Japan, South Korea, Australia, Southeast Asia, Others
-
Latin America- Brazil, Argentina, Others
-
Middle East and Africa- Saudi Arabia, UAE, Other Middle East, South Africa, Other Africa
Latest Market Updates In Chemicals
Support this report with fresh, same-industry updates that strengthen topical depth and internal linking.
Low MOQ, High-Mix Production Models for Indie & DTC Brands
The rising geopolitical and tariff-related uncertainties, in particular, amidst United States’ renewed protectionist trade stance continues to driv...
Market UpdateRise of Functional and Clinical-Grade Skincare
The rising geopolitical and tariff-related uncertainties, in particular, amidst United States’ renewed protectionist trade stance continues to driv...
By Product
Standard
Aerosol
Low Pressure and Non-Spray
By Type
Child Use
General Use
By Container
Aluminum
Steel
Tin Plate
Plastic
By Application
Personal Care
Food and Beverage
Automotive
Industrial
Pharmaceutical