Aquaculture Additives Market Snapshot: Market Size, CAGR, and Growth Outlook to 2032
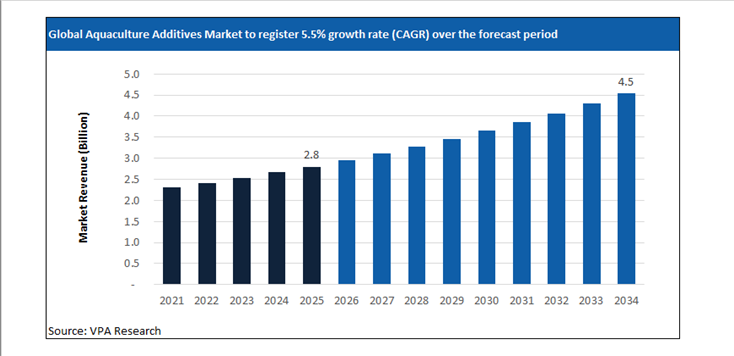
Global Aquaculture Additives Market Size is projected to hit $4.5 Billion in 2034 at a CAGR of 5.5% from $2.8 Billion Million in 2025.
The report analyzes the global Aquaculture Additives Market across diverse segments including By Additive Type (Amino Acids, Vitamins & Minerals, Probiotics & Prebiotics, Enzymes, Antioxidants, Phytogenics & Essential Oils, Feed Acidifiers, Palatants & Attractants), By Species Application (Fish, Crustaceans, Mollusks), By Source (Plant-based, Animal-based, Microbial), By Form (Dry Extruded Pellets, Moist Pellets, Micro-encapsulated Powders, Liquid Additives).
The Aquaculture Additives Market Market at a Glance (2026)
Aquaculture Additives Market, 2026: Feed Efficiency Mandates, Antibiotic Reduction, and Functional Nutrition Expansion
Aquaculture Additives Are Now Evaluated Through Performance and Regulatory Outcomes
In 2026, the aquaculture additives market is shaped by regulatory limits on antibiotic use, sustainability certification requirements, and feed efficiency targets, rather than by expansion in farmed species volumes alone. Functional additives including probiotics, enzymes, organic acids, immunostimulants, and feed attractants are increasingly central to production economics and export eligibility.
Since 2024, regulators and major seafood import markets have tightened oversight on antibiotic residues and environmental impact. This has elevated the role of additives that improve gut health, disease resistance, and nutrient absorption, allowing producers to maintain yields under more restrictive therapeutic regimes. Additives are no longer optional performance enhancers; they are risk-mitigation tools embedded into feed strategies.
Recent Industry Actions That Signal Structural Change
In 2024, DSM Firmenich expanded aquaculture nutrition solutions emphasizing digestibility and immune modulation, targeting species under high disease pressure. This development matters because it aligns additive selection with measurable production outcomes such as feed conversion ratios and mortality reduction, which are now closely audited by buyers and regulators.
During 2025, Cargill advanced partnerships and feed innovation programs focused on reduced antibiotic reliance and improved sustainability metrics. These initiatives reflect growing pressure from retailers and certification bodies demanding transparency across the aquaculture value chain.
At the policy level, several countries in Asia and Latin America updated aquaculture health and feed regulations between 2024 and 2025, reinforcing monitoring of additive use and residue management. These changes increased demand for additives with clear modes of action, documented safety profiles, and regulatory acceptance across export markets.
2026 Market Reality: Outcome-Based Procurement and Narrowing Supplier Field
By 2026, procurement in the aquaculture additives market is increasingly outcome-based. Buyers prioritize additives that demonstrate consistent improvements in feed efficiency, survival rates, and environmental impact under commercial farming conditions. Laboratory efficacy is no longer sufficient; additives must perform reliably across variable water quality, stocking densities, and disease pressures.
Cost sensitivity remains, but it is weighed against production risk and export compliance. Additives that reduce the likelihood of crop loss or shipment rejection command premium positioning. Suppliers with species-specific formulations, field trial data, and regulatory alignment across key importing regions are consolidating their position, while generic additive providers face declining relevance.
Global Aquaculture Additives Market Market Dynamics: Growth Drivers, Restraints, and Opportunities
Strategic Market Drivers: What’s Fueling Growth in 2026?
The Aquaculture Additives Market market report provides a comprehensive assessment of the structural and technical factors shaping the market’s evolution in 2026 and beyond. It evaluates demand-side shifts, supply-side constraints, regulatory influences, and technology-led disruption impacting both established players and new market entrants. The Aquaculture Additives Market market analysis details the impact of changing end-use requirements, evolving customer specifications, and increasing performance expectations across countries. Further, key drivers and opportunities are mapped across regional and application-level dynamics.
Profit Prioritization and Portfolio Rebalancing
-
Asset Rationalization: Tier 1 players are aggressively divesting low-margin, commoditized assets to reallocate capital toward high-purity, differentiated offerings with superior pricing power.
-
Operating Leverage: Amidst persistent raw material volatility, companies are leveraging Digital Twins and AI-driven manufacturing to optimize OpEx.
-
Specialty Transition: Strategic investments are now concentrated in high-growth niches where customized formulations and technical barriers to entry protect EBITDA margins from global overcapacity in basic chemicals.
A Deep Dive into Emerging Market Hubs
Rapid economic growth, coupled with demand for Aquaculture Additives Market are driving the investment focus on these markets. In particular, India, China, Southeast Asia, Brazil, Eastern Europe, and Latin American markets are registering higher than the global average growth rate. The urban population is expected to reach 6 billion by 2045, around 1.3 times the surge from 2023 levels. Rapid industrialization, infrastructure development, urbanization, and expanding domestic consumption are driving above-average demand growth across markets. Leading Aquaculture Additives Market companies are accelerating investments in local manufacturing, regional supply chains, and application-specific product development to capture these opportunities.
Emerging Opportunities: Untapped High-Growth Niches in the Post-Pandemic Recovery
The post-pandemic landscape for the chemical industry shifted from crisis management to strategic opportunity. In 2026, leading companies are focused on supply chain regionalization, the hygiene-sustainability nexus, and the digital leap in R&D. The Aquaculture Additives Market market is witnessing the emergence of niche, high-growth segments driven by evolving customer needs and regulatory drive. Demand for customized formulations, performance-enhancing solutions, and application-specific variants is rising across advanced manufacturing, specialty end-use industries, and sustainability-led applications. The report identifies underpenetrated segments where innovation, technical differentiation, and faster go-to-market strategies can unlock disproportionate value.
Aquaculture Additives Market Market Challenge- Impact of Geopolitical Uncertainty on Market Stability
In 2026, geopolitical risk has become a structural variable shaping the Aquaculture Additives Market market rather than a short-term disruption factor. Ongoing trade realignments between the U.S., China, and the EU, coupled with sanctions regimes, export controls, and industrial policy interventions, are directly influencing sourcing strategies, production footprints, and pricing stability across the Aquaculture Additives Market value chain. Regional disparities in energy pricing, port congestion risks, and shipping route instability are creating uneven cost structures among global Aquaculture Additives Market producers. Accordingly, Aquaculture Additives Market companies with regionally diversified production assets and localized supplier ecosystems are demonstrating higher margin stability compared to export-reliant peers.
Aquaculture Additives Market Market Strategic Assessment: SWOT, Five Forces, and Value Chain Analysis
Scenario analysis
Amidst varying regulations, trade patterns, supply chain dynamics, and market dynamics, the scenario analysis allows firms to stress-test their current business models. The chapter provides three distinct ‘What-If’ pathways for the Aquaculture Additives Market market through 2032- high growth, low growth, and reference cases. The detailed forward-looking assessment ensures that strategic decisions made today remain viable across a range of potential economic and regulatory outcomes.
Value Chain Analysis
The report identifies key players across the Aquaculture Additives Market industry value chain, tracing the flow from procurement to end-user. By understanding supplier dependencies, processing intensity, distribution dynamics, and customer power at each stage, stakeholders can identify opportunities for vertical integration, strategic partnerships, localization, or operational optimization.
Porter’s Five Forces Analysis
The Porter’s Five Forces analysis chapter incorporates quantitative scoring and weighted impact evaluation for each competitive force within the Aquaculture Additives Market market. This section helps objectively measure industry attractiveness, margin sustainability, and competitive risk using a standardized analytical framework. Companies can evaluate the bargaining power of suppliers and buyers, the threat of substitutes and new entrants, and the degree of rivalry among existing players.
Market Segmentation: Historical and Projected Market Revenue Forecast
Revenue Growth Strategies for Aquaculture Additives Market Segments
The report provides the Aquaculture Additives Market market size across By Additive Type (Amino Acids, Vitamins & Minerals, Probiotics & Prebiotics, Enzymes, Antioxidants, Phytogenics & Essential Oils, Feed Acidifiers, Palatants & Attractants), By Species Application (Fish, Crustaceans, Mollusks), By Source (Plant-based, Animal-based, Microbial), By Form (Dry Extruded Pellets, Moist Pellets, Micro-encapsulated Powders, Liquid Additives). Market size outlook across the segments is provided at the global, North America, Europe, Asia Pacific, South and Central America, and the Middle East and African regions. Across each segment, the report analyzes the growth prospects, post-pandemic recovery, and country-specific dynamics.
Regional Outlook for Aquaculture Additives Market Manufacturers
United States Aquaculture Additives Market Market Size and Share Analysis- Evolving Trade Policies and Supply Chain Reshuffling
The United States Aquaculture Additives Market market is being reshaped by evolving trade policies, industrial localization initiatives, and a reconfiguration of global supply chains. The outlook for 2026 is moderately higher relative to 2025, driven by policy-driven sourcing decisions, domestic manufacturing incentives, and strategic supplier realignment.
Global GDP forecasts fell to 3.0% in 2025 and 3.1% in 2026, with US growth slowing to 1.8% and 1.4%, respectively. Tariffs on critical intermediates have added around 0.5 percentage points to core inflation, squeezing the margins of downstream manufacturers. Similarly, an estimated 20% of manufacturers are likely to deploy physical AI to mitigate labor shortages in the US. Over the forecast period, as domestic pricing, margin profiles, and capacity utilization increasingly correlate with U.S.-specific trade exposure, logistics costs, and policy alignment, companies focus significantly on supply-chain optimization.
Canada Aquaculture Additives Market Industry Forecast 2026–2032- Increasing role in North America Supply Chain realignment
Canada’s real GDP growth is projected to average 1.25% to 1.5% in 2026, a modest recovery from the 1.3% growth seen in 2025. Unlike the high-volume commodity focus of previous decades, the current market is driven by high-value specialty segments. Strong end-user demand from Ontario, Alberta, Quebec, British Columbia, and other provinces is shaping the long-term growth strategies. The report analyzes the key market drivers and provides the Canada Aquaculture Additives Market market size outlook over the forecast period to 2032.
Mexico Aquaculture Additives Market - Companies are investing in Nearshoring hubs
Nearshoring into Mexico and Canada is accelerating, with the US-Mexico trade projected to grow by $315 Billion by the end of the decade. The American Chemistry Council (ACC), the National Association of the Chemical Industry of Mexico (ANIQ), and the Chemistry Industry Association of Canada (CIAC) are focusing on renewal and strengthening the USMCA. Geographic proximity to the United States enables just-in-time supply models, making Mexico a strategic production location for downstream chemical derivatives, resin conversion, coatings, adhesives, and formulation-based specialty products.
Germany Continues to Dominate the European Aquaculture Additives Market Industry
German giants are divesting non-core assets and emphasizing specialized applications, technical precision, and high-value customer solutions. For instance, Henkel’s $2.5 billion acquisition of Stahl Holdings in February 2026. Leading Aquaculture Additives Market companies are formulating strategies to mitigate short-term effects, including supply chain disruptions and destocking, and longer-term structural dynamics. Over the long-term future, demand outlook remains steady across key value chains, driving investments in new product launches and widening distribution channels.
UK- Post-Brexit Divergence and Specialized Clusters
The United Kingdom chemical industry in 2026 is shaped by divergent structural forces combining cost pressure with specialization-driven resilience. European natural gas prices remain structurally around 3.5× higher than U.S. levels, constraining energy-intensive bulk chemical economics and accelerating a pivot toward higher-value specialty chemicals, performance materials, and formulation-led production. Industry restructuring across the region is evident, with chemical plant closures in Europe increasing sixfold since 2022, according to Cefic, reinforcing the UK sector’s move away from commodity exposure toward efficiency-focused, technology-enabled operations. At the same time, logistics capacity is expanding, with the UK chemical logistics market growing at roughly 5% annually to reach about $8 billion in 2026, strengthening the country’s role as a storage, distribution, and re-export hub for specialty and regulated chemical flows.
China and India account for over 40% of global demand
China’s Aquaculture Additives Market industry is witnessing rapid capacity expansion, technology-led upgrading, and demand reorientation, with accelerated investment across value chain segments reshaping competitive dynamics. The $1.5 trillion chemical industry remains a primary engine of GDP growth, with a government-mandated target of 5% average annual growth in industrial added value through year-end 2026.
Demand fundamentals are also shifting structurally: by 2030, China and India together are projected to account for 40% of global middle-class consumption, up from less than 10% in 2010, indicating long-term expansion in consumption-driven Aquaculture Additives Market applications. Among end-user markets, Guangdong, Jiangsu, Shandong, Zhejiang, Sichuan, and others are widely focused on by vendors.
India remains a significant outlier with a projected 6.6% GDP growth in 2026, driving a surge in Aquaculture Additives Market demand. The government's $1.4 trillion National Infrastructure Pipeline is a massive driver for the market outlook. The Indian government is expected to expand the Production Linked Incentive (PLI) scheme for specialty chemicals in 2026.
Japan: Maintaining Dominance in High-Performance Segments
Japan’s Aquaculture Additives Market industry in 2026 is concentrated in high-performance, specification-critical segments where technical qualification barriers protect margins. Japan’s chemical sector remains one of the world’s most innovation-dense. In 2026, R&D spending in the sector continues to exceed $2.1 Billion annually, with Tokyo and the Kanto region serving as the global hubs for research. Persistent public-sector funding worth ¥4 trillion has moved capital toward advanced materials. To sustain competitive positioning in the evolving environment, Japanese firms can unlock growth by developing new markets through business model transformation and differentiated customer engagement strategies, reflecting the industry’s shift beyond product-led competition toward solution-oriented value creation.
Southeast Asia: The New Manufacturing Core
Southeast Asia is emerging as a primary manufacturing and chemical production growth zone, supported by industrial policy, infrastructure expansion, and supply chain diversification. Vietnam is advancing sector expansion under its Chemical Industry Development Strategy 2030, targeting average annual industry growth of 10–11% through 2030, with emphasis on petrochemicals, downstream plastics, industrial chemicals, and specialty materials serving electronics, construction, and export manufacturing.
The regional economy continues to be resilient, adapting to the shifting landscape and with momentum varying across countries and sectors. Concurrently, Indonesia is accelerating industrial capacity through its National Medium-Term Development Plan (RPJMN), which includes $414 billion in infrastructure investment, strengthening ports, energy systems, and industrial corridors critical for chemical logistics and processing industries.
Middle East- Rapid Economic Growth Supports Potential Business Expansion Opportunities
The Middle East chemical industry is strengthening its position as a global production and export hub through sustained capital deployment, feedstock integration, and downstream diversification. Between 2023 and the end of 2026, the region is tracking around 160 capital projects valued at more than $55 billion, reflecting continued investment in petrochemicals, polymers, specialty derivatives, and industrial chemicals.
The regulatory environment has become increasingly fragmented across geographies. Abundant hydrocarbon feedstocks, integrated refinery-petrochemical complexes, and export-oriented infrastructure provide structural cost advantages that support both commodity and higher-value chemical chains. In Saudi Arabia, the National Industry Strategy targets a fourfold increase in downstream chemical output by 2035, signaling a shift from base petrochemical exports toward specialty materials, performance polymers, and conversion industries.
Competitive Analysis- Intensity of Competition and Market Share
Companies are increasing R&D expenditures by 2-3% while high-intensity segments are witnessing an 8-9% increase in expenditure. The global Aquaculture Additives Market industry is characterized by intense competition with companies focusing on profit margins through widening end-user applications. Leading companies, including Cargill, Incorporated, dsm-firmenich, Archer-Daniels-Midland Company (ADM), Evonik Industries AG, BASF SE, Alltech, Inc., Kemin Industries, Inc., Nutreco N.V. (Skretting), Adisseo (Bluestar Adisseo), Novozymes (Novonesis), are analyzed in the study. For each company, a detailed business description, SWOT profile, and products and services benchmarking are provided.
Aquaculture Additives Market Market Segmentation
By Additive Type
Amino Acids
Vitamins & Minerals
Probiotics & Prebiotics
Enzymes
Antioxidants
Phytogenics & Essential Oils
Feed Acidifiers
Palatants & Attractants
By Species Application
Fish
Crustaceans
Mollusks
By Source
Plant-based
Animal-based
Microbial
By Form
Dry Extruded Pellets
Moist Pellets
Micro-encapsulated Powders
Liquid Additives
Top companies in the Aquaculture Additives Market industry
Cargill, Incorporated
dsm-firmenich
Archer-Daniels-Midland Company (ADM)
Evonik Industries AG
BASF SE
Alltech, Inc.
Kemin Industries, Inc.
Nutreco N.V. (Skretting)
Adisseo (Bluestar Adisseo)
Novozymes (Novonesis)
Countries Included-
-
North America- US, Canada, Mexico
-
Europe- Germany, France, UK, Spain, Italy, Nordics, Others
-
Asia Pacific- China, India, Japan, South Korea, Australia, Southeast Asia, Others
-
Latin America- Brazil, Argentina, Others
-
Middle East and Africa- Saudi Arabia, UAE, Other Middle East, South Africa, Other Africa
Latest Market Updates In Chemicals
Support this report with fresh, same-industry updates that strengthen topical depth and internal linking.
By Product
Amino Acids
Antibiotics
Vitamins
Feed Acidifiers
Anesthetic and Sedation Materials
Anti-Parasitics
Others
By Application
Carp
Mollusks
Salmon
Shrimps
Tilapia
Catfish
Sea Bass
Trout
Others